ETFdb Logo
  • ETF Database
  • Content Hubs
    • Themes
      • Active ETF
      • Alternatives
      • Artificial Intelligence
      • China Insights
      • Core Strategies
      • Crypto
      • Disruptive Technology
      • Energy Infrastructure
      • ETF Building Blocks
      • ETF Investing
      • ETF Strategist
      • Financial Literacy
      • Fixed Income
      • Free Cash Flow
      • Future ETFs
      • Innovative ETFs
      • Institutional Income Strategies
      • Leveraged & Inverse
      • Market Insights
      • Market Outlooks
      • Modern Alpha
      • Nuclear Energy
      • Portfolio Strategies
      • Sector Investing
      • Tax Efficient Income
      • Thematic Investing
    • Asset Class
      • Equity
        • U.S. Equity
        • Int'l Developed
        • Emerging Market Equities
      • Alternatives
        • Gold/Silver/Critical Materials
        • Cryptocurrency
        • Currency
        • Volatility
      • Fixed Income
        • Investment Grade Corporates
        • US Treasuries & TIPS
        • High Yield Corporates
        • Int'l Fixed Income
    • ETF Ecosystem
    • ETFs in Canada
    • Market Outlook
    • Crypto ETF Hub
  • Tools
    • ETF Screener
    • ETF Country Exposure Tool
    • ETF Database Categories
    • Indexes
    • Scenario Analysis
    • Watchlists
    • Head-To-Head ETF Comparison Tool
    • Mutual Fund To ETF Converter
    • ETF Stock Exposure Tool
    • ETF Issuer Fund Flows
  • Research
    • ETF Education
    • Equity Investing
    • Dividend ETFs
    • Leveraged ETFs
    • Inverse ETFs
    • Index Education
    • Index Insights
    • Top ETF Sectors
    • Top ETF Issuers
    • Top ETF Industries
  • Webcasts
  • Sectors
    • Sector Investing Content Hub
    • XLK
    • XLI
    • XLU
    • XLY
    • XLP
    • XLRE
    • Sector Power Rankings
    • XLE
    • XLC
    • XLF
    • XLV
    • XLB
  • Multimedia
    • ETF 360 Video Series
    • ETF of the Week Podcast
    • Gaining Perspective Podcast
    • ETF Prime Podcast
    • Video
  • Company
    • About VettaFi
    • Get VettaFi’ed
  • PRO
    • Pro Content
    • Pro Tools
    • Advanced
    • FAQ
    • Free sign up
    • Login
  1. Active ETF Content Hub
  2. 3 Active ETFs Sending Buy Signals
Active ETF Content Hub
Share

3 Active ETFs Sending Buy Signals

Nick Peters-GoldenMar 28, 2024
2024-03-28

Active investing has provided a lot of excitement to start 2024 following a banner year for active in 2023. Asset managers are issuing all kinds of new active ETFs, while active strategies consolidate the major flows in 2023. As such, investors may be looking for options, with three specific ETFs sending a strong buy signal per YCharts with a quarter of 2024 just about done.

See more: T. Rowe Price’s Coyne on Active ETFs in 2024

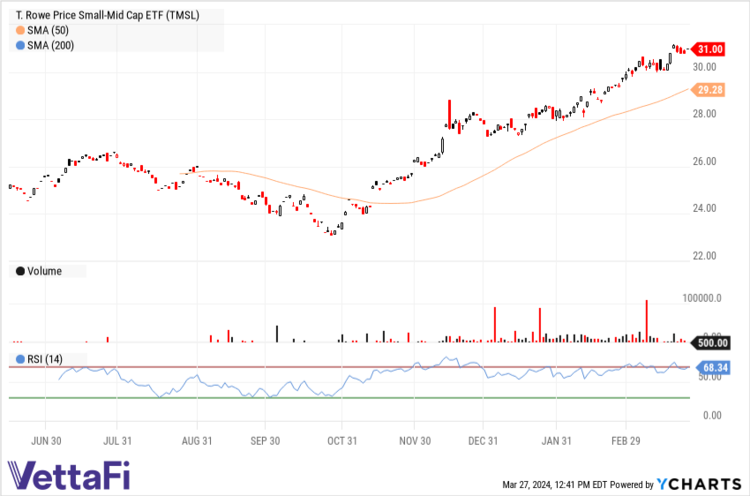
First, the T. Rowe Price Small-Mid Cap ETF (TMSL B+) can appeal. The strategy has stood out due to its strong stock selections and perhaps partly thanks to its potential to benefit from rate cuts. Its active approach, looking for smaller firms that already stand out, could also find firms that could benefit from easier borrowing. TMSL has returned 10.5% YTD for a 55 basis point (bps) fee. Its $31 price sits above its 50-day simple moving average (SMA), indicating a buy signal per YCharts.

TMSL's tech chart.
TMSL's tech chart.

Active ETFs Sending Buy Signals

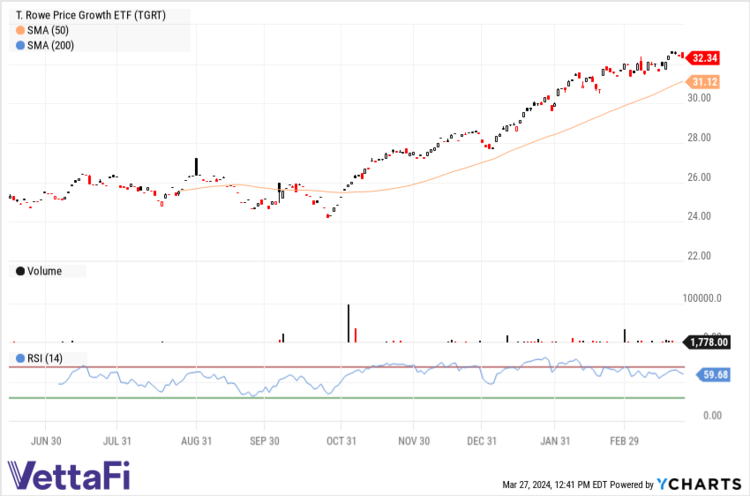
Next among active ETFs is the T. Rowe Price Growth ETF (TGRT B+). The fund charges 38 bps to look for large-cap growth stocks. It uses fundamental research and takes an active, bottom-up approach to examining potential investments. In doing so, it has returned 14.3% on a YTD basis. Its price of $32.34 sits above its 50-day SMA of $31.12, suggesting some potent momentum.


Content continues below advertisement

TGRT's tech chart.
TGRT's tech chart.

Finally, the T. Rowe Price U.S. Equity Research ETF (TSPA B) may appeal. The ETF has returned 38.4% over the last one year, charging 34 bps. Set to hit its three-year ETF milestone this June, its goal is to outperform the S&P 500 while providing similar economic exposures. It aims to be sector-neutral, weighting industries like the S&P 500, but actively selects and weights individual stocks to represent those industries per its intensive research. Since it’s inception, TSPA has delivered on its goal by outpacing the S&P 500.

TSPA's tech chart.
TSPA's tech chart.

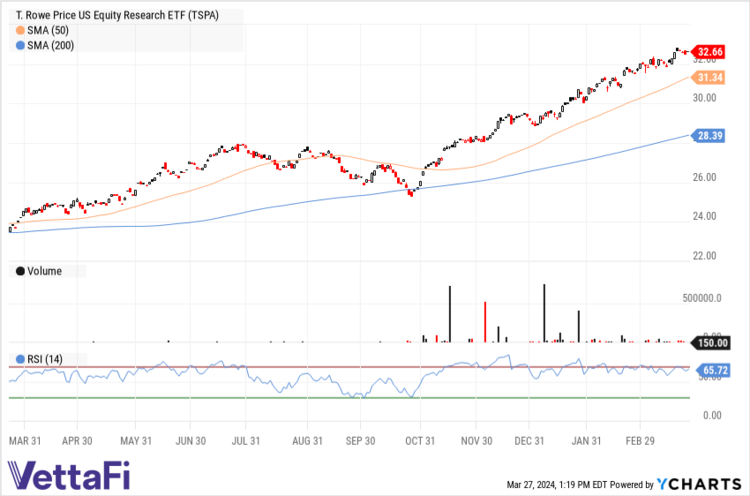
Its price of $32.66 is above its 50- and 200-day SMAs of $31.3 and $28.39, respectively. Taken together, the three active ETFs offer strong momentum and may be worth considering as active takes a step forward in 2024.

For more news, information, and analysis, visit our Active ETF Channel.

Loading Articles...

Advertisement

Is Your Portfolio Positioned With Enough Global Exposure?

ETF Education Channel

How to Allocate Commodities in Portfolios

Tom LydonApr 26, 2022
2022-04-26

A long-running debate in asset allocation circles is how much of a portfolio an investor should...

Core Strategies Channel

Why ETFs Experience Limit Up/Down Protections

Karrie GordonMay 13, 2022
2022-05-13

In a digital age where information moves in milliseconds and millions of participants can transact...

}
X