ETFdb Logo
  • ETF Database
  • Content Hubs
    • Themes
      • Active ETF
      • Alternatives
      • Artificial Intelligence
      • China Insights
      • Core Strategies
      • Crypto
      • Disruptive Technology
      • Energy Infrastructure
      • ETF Building Blocks
      • ETF Investing
      • ETF Strategist
      • Financial Literacy
      • Fixed Income
      • Free Cash Flow
      • Future ETFs
      • Innovative ETFs
      • Institutional Income Strategies
      • Leveraged & Inverse
      • Market Insights
      • Market Outlooks
      • Modern Alpha
      • Nuclear Energy
      • Portfolio Strategies
      • Sector Investing
      • Tax Efficient Income
      • Thematic Investing
    • Asset Class
      • Equity
        • U.S. Equity
        • Int'l Developed
        • Emerging Market Equities
      • Alternatives
        • Gold/Silver/Critical Materials
        • Cryptocurrency
        • Currency
        • Volatility
      • Fixed Income
        • Investment Grade Corporates
        • US Treasuries & TIPS
        • High Yield Corporates
        • Int'l Fixed Income
    • ETF Ecosystem
    • ETFs in Canada
    • Market Outlook
    • Crypto ETF Hub
  • Tools
    • ETF Screener
    • ETF Country Exposure Tool
    • ETF Database Categories
    • Indexes
    • Scenario Analysis
    • Watchlists
    • Head-To-Head ETF Comparison Tool
    • Mutual Fund To ETF Converter
    • ETF Stock Exposure Tool
    • ETF Issuer Fund Flows
  • Research
    • ETF Education
    • Equity Investing
    • Dividend ETFs
    • Leveraged ETFs
    • Inverse ETFs
    • Index Education
    • Index Insights
    • Top ETF Sectors
    • Top ETF Issuers
    • Top ETF Industries
  • Webcasts
  • Sectors
    • Sector Investing Content Hub
    • XLK
    • XLI
    • XLU
    • XLY
    • XLP
    • XLRE
    • Sector Power Rankings
    • XLE
    • XLC
    • XLF
    • XLV
    • XLB
  • Multimedia
    • ETF 360 Video Series
    • ETF of the Week Podcast
    • Gaining Perspective Podcast
    • ETF Prime Podcast
    • Video
  • Company
    • About VettaFi
    • Get VettaFi’ed
  • PRO
    • Pro Content
    • Pro Tools
    • Advanced
    • FAQ
    • Free sign up
    • Login
  1. Active ETF Content Hub
  2. The Proof in the Active Investing Pudding
Active ETF Content Hub
Share

The Proof in the Active Investing Pudding

Nick Peters-GoldenNov 10, 2023
2023-11-10

Active investing advocates often tout the ability of active strategies to outperform slower-moving, indexed strategies. That contains some common sense, to be sure, with the adaptability of active strategies empowering them to adjust weekly or even daily. However, advisors rightly look to data and the numbers before making allocations. In this case, a new 20-year study from T. Rowe Price shows that their active funds have outperformed comparable passive strategies on average.

See more: Slowing Hiring Adds to Active Investing Case

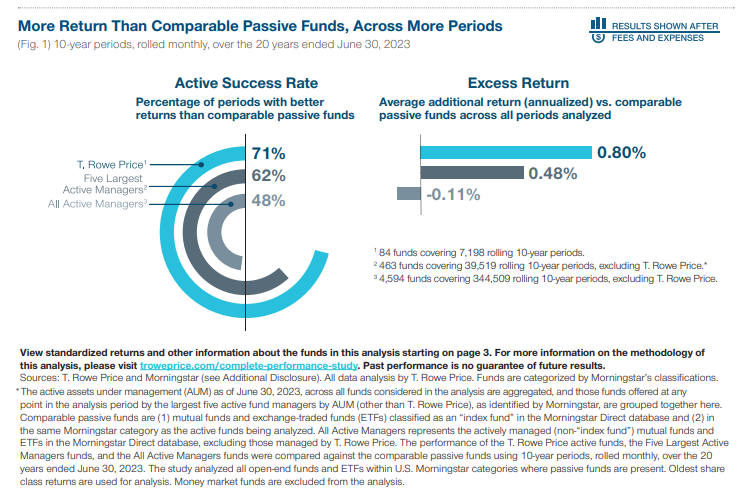
Those strategies outperformed their passive counterparts over 10-year periods when rolled monthly. That finding would contest a common misperception among investors that all active managers cannot outperform passive funds. Not only does the study cite outperformance for active versus passive funds, it also points out that T. Rowe Price’s active funds outperformed passives more often than rival active managers’ strategies.

T. Rowe Price Active Study Methodology (PDF)
T. Rowe Price's research into active investing shows broad outperformance over ten-year rolling periods vs. passives and some rivals.

T. Rowe Price Active Study Methodology

The study defined excess returns as each fund’s performance versus the passive returns average. Active success rate, meanwhile, records the percentage of rolling periods in which an active fund beats its relevant passive returns. The analysis also included fees and expenses to craft a more realistic picture of the report. In summary, T. Rowe Price’s success rate stood out, at 71%, even after fees and expenses.

Consider, for example, the T. Rowe Price Equity Income ETF (TEQI B-). The research shows that the fund has produced a 14.6% return since inception. It actively invests with a global large-cap view, looking for low price-to-earnings ratios and strong dividend yields. Per its prospectus, it compares itself to the Russell 1000 Value Index, as TEQI also has a value lean.

Per YCharts, based on total return, TEQI has outperformed the Russell 1000 Value Index by 43.2% to 35.3% since TEQI’s launch. The above research looks more in-depth, of course, but one thing is clear: It’s hard to say that active funds don’t outperform passives to a significant degree because the data says otherwise for some managers like T. Rowe Price. With 2023 being a strong year for active, investors may want to revisit their active allocations.

For more news, information, and analysis, visit our Active ETF Channel.


Content continues below advertisement

Loading Articles...

Advertisement

Is Your Portfolio Positioned With Enough Global Exposure?

ETF Education Channel

How to Allocate Commodities in Portfolios

Tom LydonApr 26, 2022
2022-04-26

A long-running debate in asset allocation circles is how much of a portfolio an investor should...

Core Strategies Channel

Why ETFs Experience Limit Up/Down Protections

Karrie GordonMay 13, 2022
2022-05-13

In a digital age where information moves in milliseconds and millions of participants can transact...

}
X