ETFdb Logo
  • ETF Database
  • Content Hubs
    • Themes
      • Active ETF
      • Alternatives
      • Artificial Intelligence
      • China Insights
      • Core Strategies
      • Crypto
      • Disruptive Technology
      • Energy Infrastructure
      • ETF Building Blocks
      • ETF Investing
      • ETF Strategist
      • Financial Literacy
      • Fixed Income
      • Free Cash Flow
      • Future ETFs
      • Innovative ETFs
      • Institutional Income Strategies
      • Leveraged & Inverse
      • Market Insights
      • Market Outlooks
      • Modern Alpha
      • Nuclear Energy
      • Portfolio Strategies
      • Sector Investing
      • Tax Efficient Income
      • Thematic Investing
    • Asset Class
      • Equity
        • U.S. Equity
        • Int'l Developed
        • Emerging Market Equities
      • Alternatives
        • Gold/Silver/Critical Materials
        • Cryptocurrency
        • Currency
        • Volatility
      • Fixed Income
        • Investment Grade Corporates
        • US Treasuries & TIPS
        • High Yield Corporates
        • Int'l Fixed Income
    • ETF Ecosystem
    • ETFs in Canada
    • Market Outlook
    • Crypto ETF Hub
  • Tools
    • ETF Screener
    • ETF Country Exposure Tool
    • ETF Database Categories
    • Indexes
    • Scenario Analysis
    • Watchlists
    • Head-To-Head ETF Comparison Tool
    • Mutual Fund To ETF Converter
    • ETF Stock Exposure Tool
    • ETF Issuer Fund Flows
  • Research
    • ETF Education
    • Equity Investing
    • Dividend ETFs
    • Leveraged ETFs
    • Inverse ETFs
    • Index Education
    • Index Insights
    • Top ETF Sectors
    • Top ETF Issuers
    • Top ETF Industries
  • Webcasts
  • Sectors
    • Sector Investing Content Hub
    • XLK
    • XLI
    • XLU
    • XLY
    • XLP
    • XLRE
    • Sector Power Rankings
    • XLE
    • XLC
    • XLF
    • XLV
    • XLB
  • Multimedia
    • ETF 360 Video Series
    • ETF of the Week Podcast
    • Gaining Perspective Podcast
    • ETF Prime Podcast
    • Video
  • Company
    • About VettaFi
  • PRO
    • Pro Content
    • Pro Tools
    • Advanced
    • FAQ
    • Free sign up
    • Login
  1. Active ETF Content Hub
  2. TVAL Combines Diversification & Outperformance YTD
Active ETF Content Hub
Share

TVAL Combines Diversification & Outperformance YTD

Karrie GordonFeb 18, 2025
2025-02-18

Advisors and investors seeking to diversify their equity portfolios this year should consider the T. Rowe Price Value ETF (TVAL B+). The fund combines active management and value investing in a strategy and offers outperformance compared to its benchmark YTD.

TVAL seeks long-term capital growth by investing in undervalued companies. While some companies may have recently fallen out of favor, the fund managers believe they demonstrate notable potential for capital appreciation. The fund may invest across market caps but primarily invests in large-cap stocks.

The management team creates the portfolio using bottom-up analysis of individual securities. This analysis focuses on individual stock performance and metrics but does consider macro trends. The bottom-up analysis measures dividend yield, price/earnings ratios, price/book value ratios, cash flow, and more. The strategy also considers any undervalued assets and restructuring opportunities a company may have.

Diversification & Outperformance When Value Investing

The focus on value stocks creates a diversified portfolio compared to broad equity benchmarks. TVAL’s top sectors by weight included financials at 24.52%, industrials at 16.39%, and healthcare at 14.06%, as of January 31, 2025. For comparison, the broad Russell 1000 Index’s top sectors included information technology at 34.63%, consumer discretionary at 15.77%, and industrials at 12.59% as of the end of January, according to FTSE Russell data.


Content continues below advertisement

TVAL vs IWD TRs

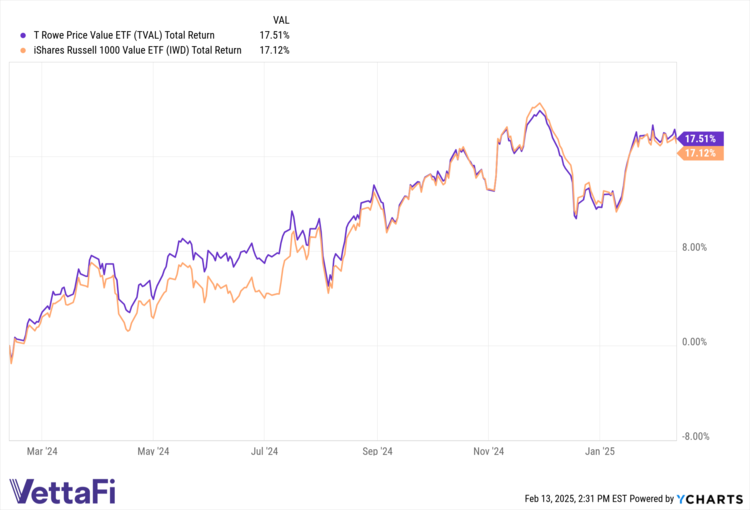
TVAL also outperforms the Russell 1000 Value Index benchmark, measured using the iShares Russell 1000 Value ETF (IWD A-). TVAL generated higher total returns than IWD year to date and over the trailing 12-month period that ended on February 12, 2025. TVAL is up 5.17% YTD compared to IWD’s 4.33% as of February 12, 2025, according to Y-Charts data. It also outperforms the broad Russell 1000 Index YTD, with the Index offering total returns of 3.27% over the same period.

TVAL carries an expense ratio of only 0.33%, making it an affordable, actively managed solution for investors seeking equity diversification.

For more news, information, and analysis, visit our Active ETF Channel.

Loading Articles...

Advertisement

Is Your Portfolio Positioned With Enough Global Exposure?

ETF Education Channel

How to Allocate Commodities in Portfolios

Tom LydonApr 26, 2022
2022-04-26

A long-running debate in asset allocation circles is how much of a portfolio an investor should...

Core Strategies Channel

Why ETFs Experience Limit Up/Down Protections

Karrie GordonMay 13, 2022
2022-05-13

In a digital age where information moves in milliseconds and millions of participants can transact...

}
X