

Recent selloffs of carbon allowance funds based in the European markets have caused dips in those funds, but KraneShares believes that it’s only a short-term reaction in a long-term upward trend.
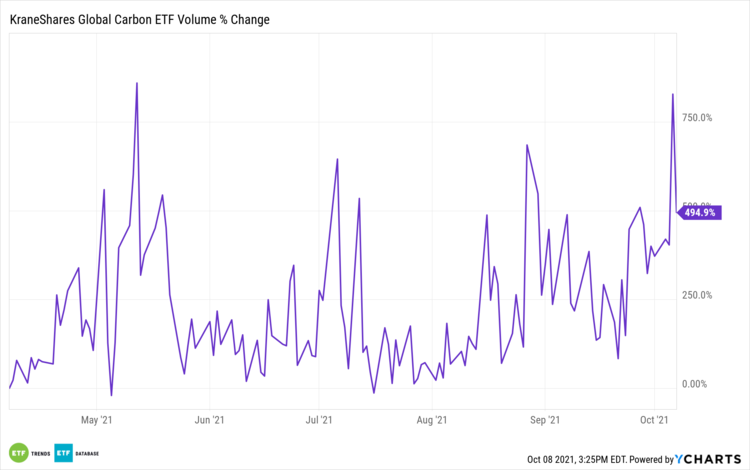
Luke Oliver, managing director and head of strategy for KraneShares, told ETF Trends that because of pullback in the European markets, the KraneShares Global Carbon ETF (KRBN ) as well as the newly launched KraneShares European Carbon Allowance ETF (KEUA ) are both experiencing selloffs. KRBN carries heavy allocation in the European Union Allowances, and KEUA is targeted solely within the market.
Oliver attributed the selloff to political risk, saying, “Greece expressed concerns about the rising price of carbon which led some investors to reduce risk, alongside a broader de-risking in Europe.”
The fall of natural gas prices also contributed to the EUA selloff, but Oliver warned that Greece’s belief that rising carbon prices were linked to the rise of energy prices was misplaced. The driving factor behind the energy price crisis that much of Europe is experiencing is one that Oliver believes can be attributed instead to low gas supply overall, abnormally low reserves for winter, the pressure of the demand from China and India, and coal shortages.
Natural gas movement is not directly reflective of carbon prices either, as natural gas prices have risen exponentially; prices for natural gas are up roughly 400% year-to-date compared to the much more modest 78% rise seen in carbon allowance prices.
Oliver believes that, long-term, the E.U. will not shift its stance on carbon because of Greece’s recent accusations; indeed, the cap reduction was recently bumped to 4.2% from the former 2.2% cap in order to more aggressively combat emissions and meet Paris Agreement goals.
“The falling cap, shift from surplus to deficit allowances and continued use of fossil fuels maintain the bull story for carbon prices,” Oliver claimed, going on to warn that “carbon prices have historically been more volatile than equities and should be considered when investing.”
Investing in the EUA With KraneShares
The KraneShares Global Carbon ETF (KRBN ) offers a first-of-its-kind take on carbon credits trading.
KRBN tracks the IHS Markit Global Carbon Index, which follows the most liquid carbon credit futures contracts in the world. This includes contracts from the European Union Allowances (EUA), California Carbon Allowances (CCA), and Regional Greenhouse Gas Initiative (RGGI) markets. North American pricing data is supplied by IHS Markit’s OPIS service, while European prices are supplied by ICE Futures Pricing.
Of note, 71% of KRBN’s current exposure is in EUA.
KRBN invests in its futures contracts via a Cayman Islands subsidiary, meaning that it can avoid distributing the dreaded K-1 tax form to its shareholders.
KRBN carries an expense ratio of 0.78% and has over $959 million in net assets.
The KraneShares European Carbon Allowance ETF (KEUA ) offers targeted exposure into the E.U. carbon allowances market only, capturing the increasing prices in the highest-priced carbon allowance market globally.
KEUA offers exposure to the European Union Allowances cap-and-trade carbon allowance program only and is actively managed.
The fund’s benchmark is the IHS Markit Carbon EUA Index, an index that tracks the most-traded EUA futures contracts, a market that is the oldest and most liquid for carbon allowances. The market currently offers coverage for roughly 40% of all emissions from the E.U., including 27 member states as well as Norway, Iceland, and Liechtenstein. The annual cap reduction was recently increased from 2.2% to 4.2% to meet long-term carbon emission targets.
As the fund is actively managed, it may invest in carbon credit futures with different maturity dates or weight futures differently from the index. The fund potentially trades in CTFC-regulated futures and swaps above the CFTC 4.5 limit and is therefore considered a “commodity pool.”
KEUA has an expense ratio of 0.79%.
For more news, information, and strategy, visit the China Insights Channel.

