ETFdb Logo
  • ETF Database
  • Content Hubs
    • Themes
      • Active ETF
      • Alternatives
      • Artificial Intelligence
      • China Insights
      • Core Strategies
      • Crypto
      • Disruptive Technology
      • Energy Infrastructure
      • ETF Building Blocks
      • ETF Investing
      • ETF Strategist
      • Financial Literacy
      • Fixed Income
      • Free Cash Flow
      • Future ETFs
      • Innovative ETFs
      • Institutional Income Strategies
      • Leveraged & Inverse
      • Market Insights
      • Market Outlooks
      • Modern Alpha
      • Nuclear Energy
      • Portfolio Strategies
      • Sector Investing
      • Tax Efficient Income
      • Thematic Investing
    • Asset Class
      • Equity
        • U.S. Equity
        • Int'l Developed
        • Emerging Market Equities
      • Alternatives
        • Gold/Silver/Critical Materials
        • Cryptocurrency
        • Currency
        • Volatility
      • Fixed Income
        • Investment Grade Corporates
        • US Treasuries & TIPS
        • High Yield Corporates
        • Int'l Fixed Income
    • ETF Ecosystem
    • ETFs in Canada
    • Market Outlook
    • Crypto ETF Hub
  • Tools
    • ETF Screener
    • ETF Country Exposure Tool
    • ETF Database Categories
    • Indexes
    • Scenario Analysis
    • Watchlists
    • Head-To-Head ETF Comparison Tool
    • Mutual Fund To ETF Converter
    • ETF Stock Exposure Tool
    • ETF Issuer Fund Flows
  • Research
    • ETF Education
    • Equity Investing
    • Dividend ETFs
    • Leveraged ETFs
    • Inverse ETFs
    • Index Education
    • Index Insights
    • Top ETF Sectors
    • Top ETF Issuers
    • Top ETF Industries
  • Webcasts
  • Sectors
    • Sector Investing Content Hub
    • XLK
    • XLI
    • XLU
    • XLY
    • XLP
    • XLRE
    • Sector Power Rankings
    • XLE
    • XLC
    • XLF
    • XLV
    • XLB
  • Multimedia
    • ETF 360 Video Series
    • ETF of the Week Podcast
    • Gaining Perspective Podcast
    • ETF Prime Podcast
    • Video
  • Company
    • About VettaFi
    • Get VettaFi’ed
  • PRO
    • Pro Content
    • Pro Tools
    • Advanced
    • FAQ
    • Free sign up
    • Login
  1. China Insights Content Hub
  2. World Markets Watchlist: 2024 Wrap-Up
China Insights Content Hub
Share

World Markets Watchlist: 2024 Wrap-Up

Jennifer NashJan 02, 2025
2025-01-02

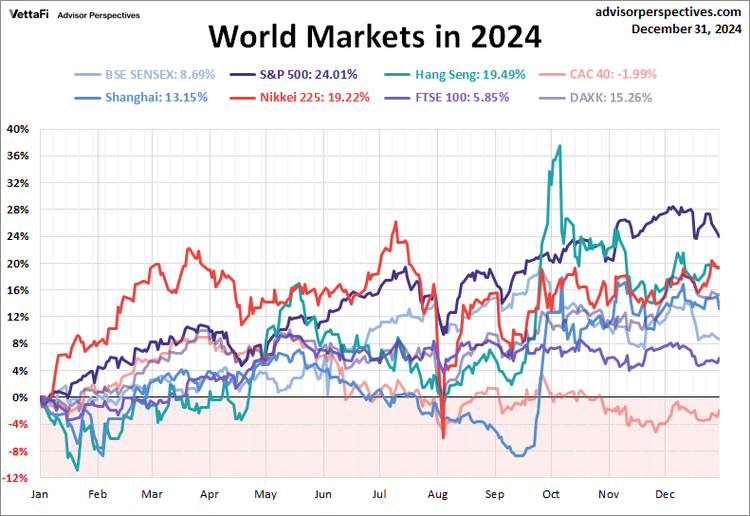
Our global markets watchlist tracks eight prominent indexes from economies around the world. The list includes the S&P 500 from the United States, the FTSE 100 from England, the DAXK from Germany, the CAC 40 from France, the Nikkei 225 from Japan, the Shanghai from China, the Hang Seng from Hong Kong, and the BSE SENSEX from India.

Seven of our eight indexes

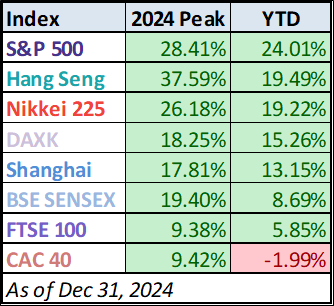
Seven of our eight indexes on our world watch list posted gains in 2024. The U.S. S&P 500 finished the year in the top spot with an annual gain of 24.01%. Hong Kong’s Hang Seng finished in second with an annual gain of 19.49% while Tokyo’s Nikkei 225 finished in third with an annual gain of 19.22%.

France’s CAC was the sole index on our watchlist to finish down on the year with an annual loss of -1.99%.

World Indexes and Recent Recessions

Content continues below advertisement

World Indexes and Recent Recessions

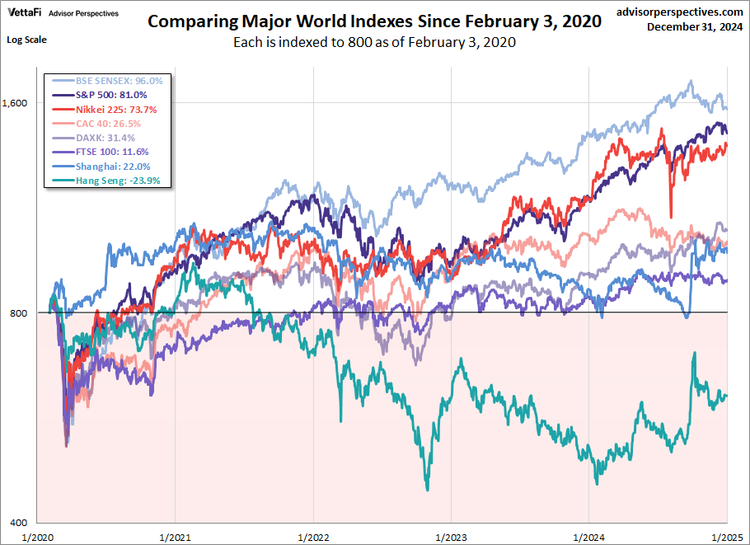
Let’s start with a very recent chart with the latest recession. We’ve used February 3, 2020 for our start date (this is the official NBER recession start).

chart below illustrates the comparative

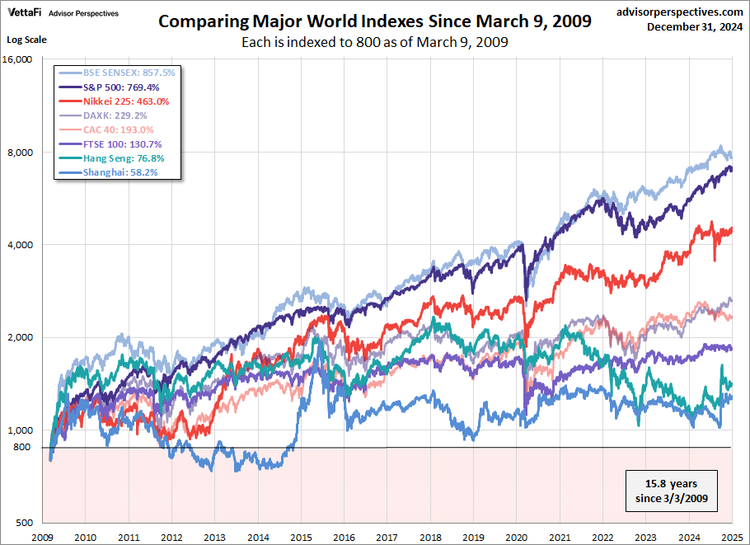
The chart below illustrates the comparative performance of world markets since March 9, 2009. The start date is arbitrary: The S&P 500, CAC 40 and BSE SENSEX hit their lows on March 9th, the Nikkei 225 on March 10th, the DAXK on March 6th, the FTSE on March 3rd, the Shanghai Composite on November 4, 2008, and the Hang Seng even earlier on October 27, 2008. However, by aligning on the same day and using a log-scale vertical axis, we get an excellent visualization of the relative performance. I’ve indexed each of the eight to 800 on the March 9th start date. The callout in the upper left corner shows the percent change from the start date to the latest weekly close.

Here is the same visualization

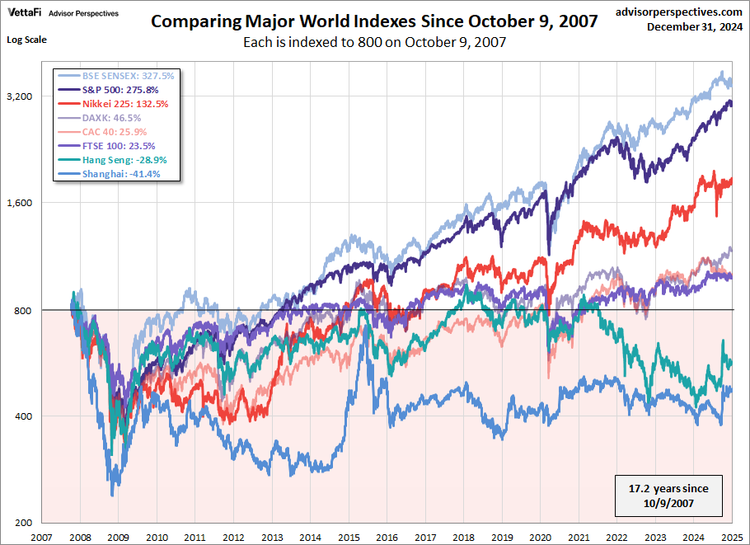
Here is the same visualization, this time starting on October 9, 2007, a previous closing high for the S&P 500. This date is also approximately the mid-point of the range of market peaks, which started on June 1st for the CAC 40 and ended on January 8, 2008 for the SENSEX.

For a longer look at the relative

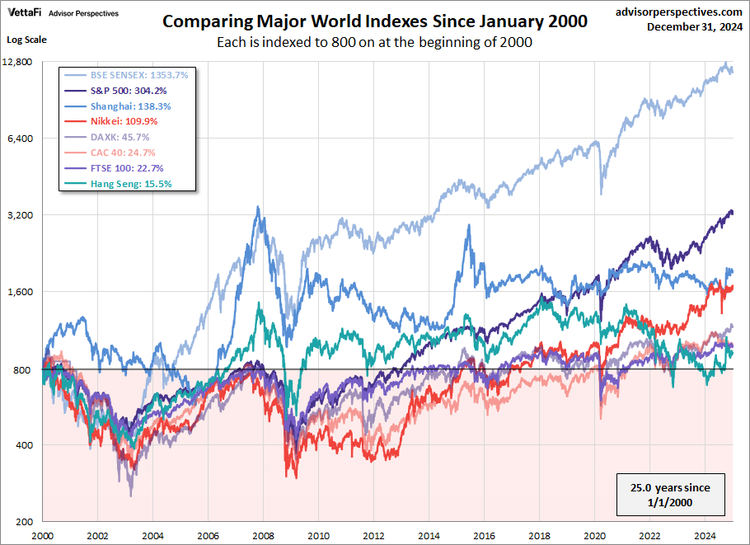
For a longer look at the relative performance, our final chart starts at the turn of the century. Again, it is indexing each at 800 for the start date.

Examples of single-country

Examples of single-country ETFs:

  • WisdomTree Japan Hedged Equity Fund (DXJ B-)
  • WisdomTree Europe Hedged Equity Fund (HEDJ B)
  • KraneShares CSI China Internet ETF (KWEB B)
  • iShares MSCI India ETF (INDA C+)
  • iShares MSCI Hong Kong ETF (EWH B+)
  • SPDR S&P 500 ETF Trust (SPY A-)

Note: I track Germany’s DAXK a price-only index, instead of the more familiar DAX index (which includes dividends), for consistency with the other indexes, which do not include dividends.

Originally published on Advisor Perspectives.

For more news, information, and analysis, visit the China Insights Channel.

Loading Articles...

Advertisement

Is Your Portfolio Positioned With Enough Global Exposure?

ETF Education Channel

How to Allocate Commodities in Portfolios

Tom LydonApr 26, 2022
2022-04-26

A long-running debate in asset allocation circles is how much of a portfolio an investor should...

Core Strategies Channel

Why ETFs Experience Limit Up/Down Protections

Karrie GordonMay 13, 2022
2022-05-13

In a digital age where information moves in milliseconds and millions of participants can transact...

}
X