

Climate concerns are more top of mind in a week when much of the Northeastern US contends with wildfire smoke. Over in Europe, the price of European Union carbon allowances made strong weekly gains, and the KraneShares European Carbon Allowance ETF (KEUA ) benefited.
Global economic slowing and worries of recession weigh heavily on Europe. European Union Allowances (EUAs) historically have low correlations to equities but are still impacted by the macro environment.
Muted economic expectations weighed heavily on EUAs in recent months and prices are off their February 2023 highs. Industrial production output dropped 2.5% month-over-month in March in the EU. Industrial emissions are a large driver of carbon allowances demand.
EU Carbon Allowances Face Challenges in 2023
Alongside macro impacts were 2022 emissions reports that revealed lower-than-expected emissions. High emitting industries such as steel, cement, and fertilizers pulled back on production last year due to high energy prices explained Luke Oliver, managing director, head of climate investments, and head of strategy at KraneShares, in the Climate Market Now blog. This in turn drove down industrial emissions alongside fewer emissions from the short-term pivot to coal last year than forecast.
Collectively emissions in the EU rose slightly less than 1% in 2022 compared to 2021 levels. Plummeting natural gas prices also “flipped the power generation merit order back in favor of gas” over coal this year, Oliver explained.
“After this summer, the carbon permit supply is also set to increase,” wherein 16.5 million EUAs are added to the supply beginning in September. These allowances are frontloaded from future auctions, which means longer-term supply tightening but short-term supply surplus. The sale of the additional EUAs will fund the EU’s permanent transition away from Russian energy supply reliance and is part of the REPowerEU initiative.

Despite short-term headwinds, carbon allowance futures rose 10% in the last week to hit €86. Prices have fluctuated between €79 and €100 in the previous three months.
“Prices have a more balanced outlook as the summer holiday period approaches,” Oliver said.
REPowerEU and the recently passed “Fit for 55” legislation create long-term strength for carbon allowance prices. The EU market tightens every year, with fewer allowances issued, creating greater scarcity while more participants continue to enter the market.
Longer-Term Support Creates Brighter Future for EUAs
Although there are short-term challenges to EUA prices, the longer-term outlook has a promising foundation. Between September of this year and August 2024, 270 million EUAs will be pulled from the market. These EUAs will be placed in the Market Stability Reserve (MSR). The MSR mitigates strong volatility by withdrawing or injecting additional allowances into the market depending on the number of allowances currently circulating.
“A number of stakeholders have pointed out that the market consumes more EUAs than are issued each year,” said Oliver. This in turn “will continue to tighten the overall supply over time.”
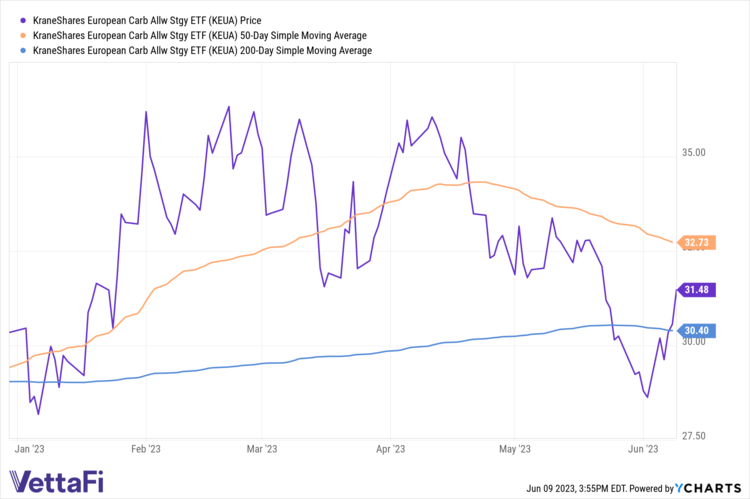
The KraneShares European Carbon Allowance ETF (KEUA ) offers targeted exposure to the EU carbon allowances market and is actively managed. KEUA has fallen below its 50-day simple moving average but recently crossed above its 200-day SMA after dipping below briefly. It’s a fund to watch and consider in the coming weeks and months.
The fund’s benchmark is the IHS Markit Carbon EUA Index. This benchmark tracks the most-traded EUA futures contracts, the oldest and most liquid carbon allowances market. Currently, the market covers roughly 40% of all EU emissions, including 27 member states and Norway, Iceland, and Liechtenstein.
KEUA has an expense ratio of 0.78%.
For more news, information, and analysis, visit the Climate Insights Channel.

