ETFdb Logo
  • ETF Database
  • Content Hubs
    • Themes
      • Active ETF
      • Alternatives
      • Artificial Intelligence
      • China Insights
      • Core Strategies
      • Crypto
      • Disruptive Technology
      • Energy Infrastructure
      • ETF Building Blocks
      • ETF Investing
      • ETF Strategist
      • Financial Literacy
      • Fixed Income
      • Free Cash Flow
      • Future ETFs
      • Innovative ETFs
      • Institutional Income Strategies
      • Leveraged & Inverse
      • Market Insights
      • Market Outlooks
      • Modern Alpha
      • Nuclear Energy
      • Portfolio Strategies
      • Sector Investing
      • Tax Efficient Income
      • Thematic Investing
    • Asset Class
      • Equity
        • U.S. Equity
        • Int'l Developed
        • Emerging Market Equities
      • Alternatives
        • Gold/Silver/Critical Materials
        • Cryptocurrency
        • Currency
        • Volatility
      • Fixed Income
        • Investment Grade Corporates
        • US Treasuries & TIPS
        • High Yield Corporates
        • Int'l Fixed Income
    • ETF Ecosystem
    • ETFs in Canada
    • Market Outlook
    • Crypto ETF Hub
  • Tools
    • ETF Screener
    • ETF Country Exposure Tool
    • ETF Database Categories
    • Indexes
    • Scenario Analysis
    • Watchlists
    • Head-To-Head ETF Comparison Tool
    • Mutual Fund To ETF Converter
    • ETF Stock Exposure Tool
    • ETF Issuer Fund Flows
  • Research
    • ETF Education
    • Equity Investing
    • Dividend ETFs
    • Leveraged ETFs
    • Inverse ETFs
    • Index Education
    • Index Insights
    • Top ETF Sectors
    • Top ETF Issuers
    • Top ETF Industries
  • Webcasts
  • Sectors
    • Sector Investing Content Hub
    • XLK
    • XLI
    • XLU
    • XLY
    • XLP
    • XLRE
    • Sector Power Rankings
    • XLE
    • XLC
    • XLF
    • XLV
    • XLB
  • Multimedia
    • ETF 360 Video Series
    • ETF of the Week Podcast
    • Gaining Perspective Podcast
    • ETF Prime Podcast
    • Video
  • Company
    • About VettaFi
    • Get VettaFi’ed
  • PRO
    • Pro Content
    • Pro Tools
    • Advanced
    • FAQ
    • Free sign up
    • Login
  1. Climate Insights Content Hub
  2. An Advisor’s Guide to Carbon Allowance Portfolio Allocation
Climate Insights Content Hub
Share

An Advisor's Guide to Carbon Allowance Portfolio Allocation

Karrie GordonJul 18, 2024
2024-07-18

Investors looking for opportunity and diversification beyond traditional allocations would do well to consider carbon allowances. Carbon allowance investing offers a diversified return stream for portfolios from traditional stocks and bonds with notable returns over time.

In the decade between August 2014 and June 2024, the annualized returns of carbon allowances were 20.43%,  according to Bloomberg data, cited by KraneShares. Carbon allowance measurements included the top four markets, weighted according to volume. In comparison, the S&P 500 Index generated 12.98% annualized returns, while the Agg generated returns of 1.41%.

This asset class generated higher annualized returns than stocks and bonds with low correlations. Carbon allowance correlations were just 0.307 for U.S. equities and 0.085 for U.S. bonds over the same period. It’s worth noting that volatility for carbon allowances were significantly elevated over equities and bonds in the decade measured. Carbon allowances generated annualized volatility of 28.79%, equities 15.39%, and bonds 4.84%.

Given returns and low correlations, carbon allowances make a notable addition to portfolios for those with the appetite for volatility.

“Adding carbon allowances may enhance returns when used as a complement to a traditional 60% stock and 40% bond portfolio,” KraneShares wrote.

Image source: KraneShares

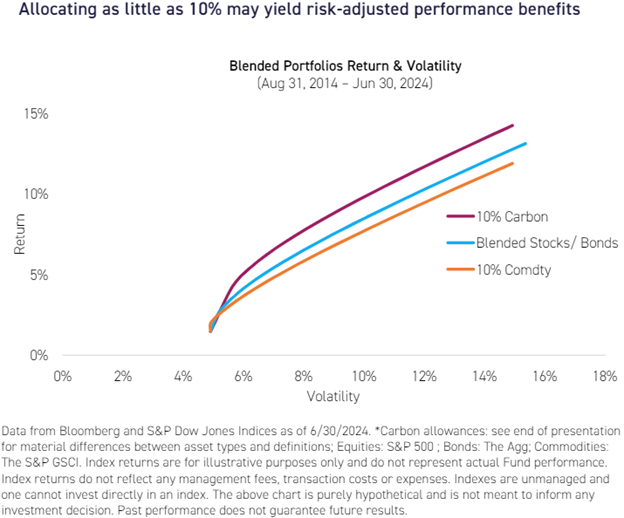
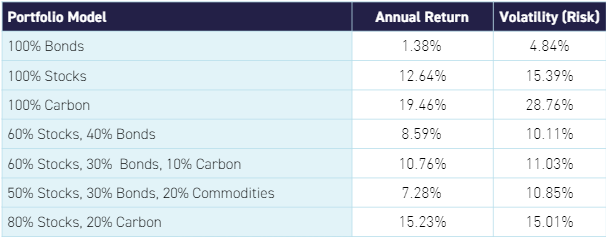
KraneShares calculated annual returns and volatility for a variety of portfolio models to demonstrate the impact carbon allowances may have. A traditional portfolio of 60% equities and 40% bonds, using the S&P 500 and Agg respectively, offered an annual return of 8.59% over the last decade. Its volatility clocked in at 10.11%. Meanwhile, a portfolio of 50% stocks, 30% bonds, and 20% commodities offered annual returns of 7.28% and volatility of 10.85%.

However, a portfolio comprising 60% stocks, 30% bonds, and 10% carbon allowances generated annual returns of 10.76%. Volatility measured 11.03% over the same period.


Content continues below advertisement

Image source: KraneShares

The KraneShares Global Carbon Strategy ETF (KRBN B-) was the first of its kind to offer an investment take on carbon credits trading. KRBN tracks the S&P Global Carbon Credit Index, which follows the world’s most liquid carbon credit futures contracts.

This includes contracts from the European Union Allowances and California Carbon Allowances. It also includes the RGGI markets and the United Kingdom Allowances. KRBN carries a management fee of 0.79%.

For more news, information, and analysis, visit the Climate Insights Channel.

Loading Articles...

Advertisement

Is Your Portfolio Positioned With Enough Global Exposure?

ETF Education Channel

How to Allocate Commodities in Portfolios

Tom LydonApr 26, 2022
2022-04-26

A long-running debate in asset allocation circles is how much of a portfolio an investor should...

Core Strategies Channel

Why ETFs Experience Limit Up/Down Protections

Karrie GordonMay 13, 2022
2022-05-13

In a digital age where information moves in milliseconds and millions of participants can transact...

}
X