


U.S. Harvest Preview
Jake Hanley, CMT Managing Director / Sr. Portfolio Strategist | September 3, 2024
For U.S. farmers the time has come to reap what has been sown. The coming harvest should be one for the history books. Per the August WASDE report, the USDA is projecting record corn yields of 183.1 bushels per acre on 82.7 million harvested acres. As such, U.S. corn farmers are expected to haul in 15.147 billion bushels of corn. If realized it will be the 4th largest corn crop in U.S. history.
For U.S. farmers the time has come to reap what has been sown. The coming harvest should be one for the history books. Per the August WASDE report, the USDA is projecting record corn yields of 183.1 bushels per acre on 82.7 million harvested acres. As such, U.S. corn farmers are expected to haul in 15.147 billion bushels of corn. If realized it will be the 4th largest corn crop in U.S. history.
What’s more, we may soon realize a new record high in U.S. soybean production made possible by record yields of 53.2 bushels per acre harvesting 86.3 million acres.
The USDA may adjust some projections in September, but any changes would likely be marginal. The U.S. is about to make a significant contribution to global corn and soybean balance sheets, keeping pressure on futures prices. In addition, well established seasonal patterns suggest that annual price lows in corn and soybean markets are right around the corner. As such, there appears to be an opportunity developing for those investors who follow the adage “buy low, sell high.”
While farmers are about to reap, perhaps investors should consider this as a time to sow.
Buying Low
The harvest will likely be the turning point that market participants and investors (surely our readers) have been anticipating for some time. That is a return to stage 1 of the golden grain cycle.
As a reminder, the golden grain cycle consists of three stages:
- Prices trade at or near the cost of production
- Prices advance dramatically due to supply/demand imbalance
- Prices head back toward production costs as supply catches up with demand
We’ve been in stage 3 for two years. Corn prices are now trading near the national average cost of production (which we estimate to be ~ $3.50). Soybean prices remain somewhat elevated relative to the historical production cost level around $8.80. However recent market dynamics suggest that additional downside from current levels may be limited.
Typically, seasonal price lows coincide with the US harvest, and corn prices have been following the seasonal pattern closely as of late.
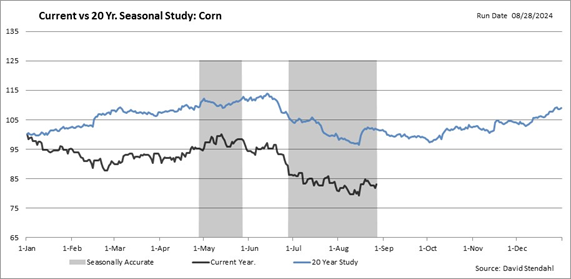
The shaded areas on the chart above illustrate periods where the price action correlates with the historical pattern. With history as a guide, we’d expect prices to head lower into early October before advancing into year-end and through next Spring. Of course, past performance does not guarantee future results.
There is a similar pattern playing out in the soybean futures market as well.
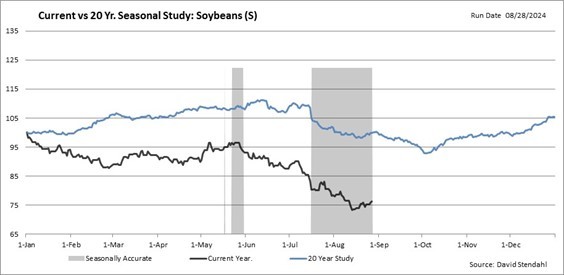
Note the 20 years seasonal price pattern shows that soybeans, like corn, tend to experience downward price pressure heading into early October.
With the expectation for prices to drift lower into early October, we are confident that we are at the beginning of a new Stage #1 in the Golden Grain Cycle.
Flush Global Supplies
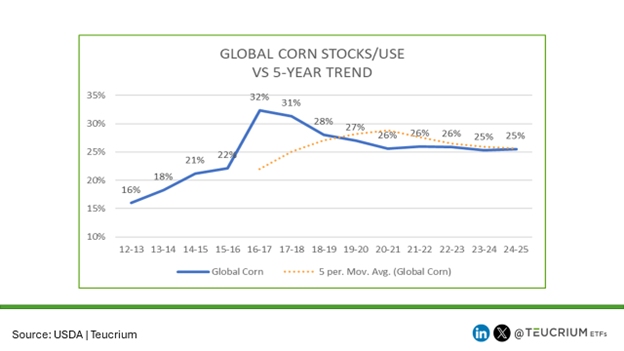
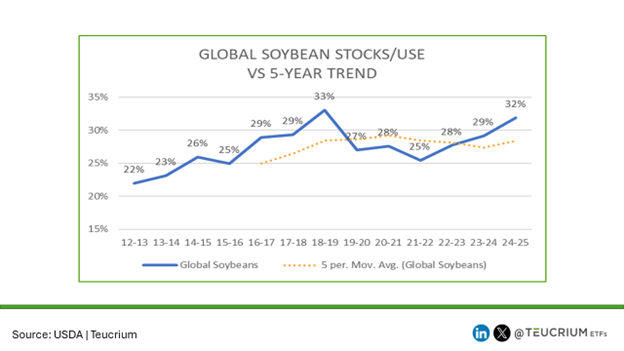
The charts above illustrate global stocks/use ratios which are determined by taking expected ending stocks (i.e. excess annual supply) and dividing by the expected usage. U.S. production estimates are included in the global stocks figure and, as one can see, the world has plenty of corn and soybeans. As such, there is an opportunity developing for those investors looking to diversify their portfolios with a low correlated, historically low-priced asset class trading near the bottom of longstanding historical trading price ranges.
Home in the Range
Fundamentally there is no reason to expect corn or soybean markets to transition back into a stage 2 price rally cycle in the near term. There is plenty of both corn and soybeans, and we know that prices can trade in a broad sideways range for an extended period. Importantly, while prices may periodically dip below production cost levels, they often recover quickly. As you can see on the chart below, when front-month corn futures have traded below $3.50, they have not stayed there for long.
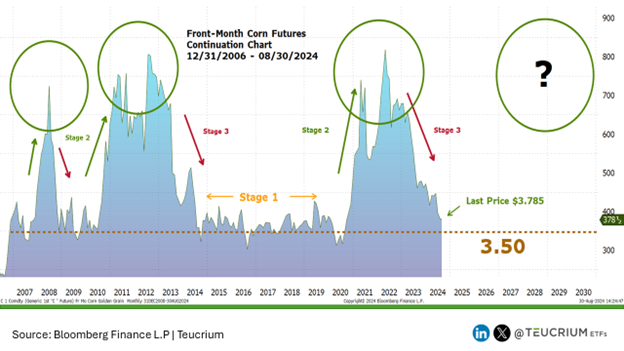
In-fact, the average daily price close for the period between January 2015 through December 2020 was $3.68, with a low of $3.015.
This suggests limited downside risk, which has often been an appealing proposition for traders. After all, we’ve seen how quickly money flows to oil when prices pull back toward cost of production levels. In 2015 one oil ETF alone is estimated to have taken in over $3 billion in new flows as crude oil prices headed toward $40 per barrel.1
Corn below $4 is somewhat akin to oil below $40. Fundamentally, history has shown that there just isn’t much downside.
Susceptible to Shock
Keep in mind that while corn and soybean balance sheets are expanding, the global wheat balance sheet is contracting. Lumping the three crops together we see that excess production over the past few years pales in comparison to the previous decade (the last time we were in stage 1).
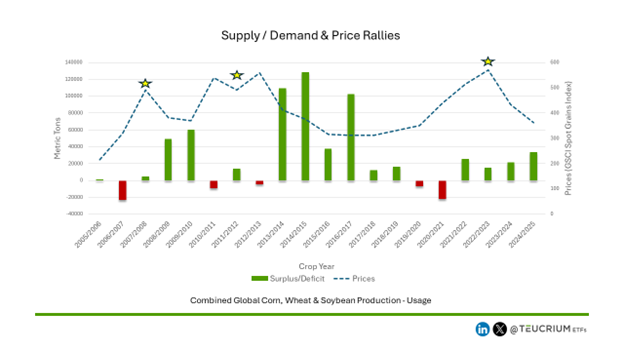
This suggests that grains are susceptible to shock. Given current price levels, the surprise is certainly to the upside, and while the fundamentals do not suggest a near-term concern for prices to move higher, certainly a shock (military escalation or volatile weather) could ignite new buying across the board. Whatever the catalyst might be, the risk appears to be to the upside.
Conclusion
While U.S. farmers are about to reap a record crop, traders and allocators looking to buy low, are likely preparing to sow. Planting grains in a portfolio while they are trading at or near production costs levels has historically yielded diversification benefits and profit over time.
As we transition to stage #1 of the Golden Grain Cycle, it is once again time to sow.
Keep up with the Golden Grain Cycle here: https://insights.teucrium.com/golden-grain-cycle
Subscribe to our newsletter https://insights.teucrium.com/alternative-market-access-simplified
Follow Us on Social X and LinkedIn @TeucriumETFs
sourced from Bloomberg Finance, L.P. United States Oil Fund, L.P. cumulative money flow January 1, 2015 – December 31, 2015 $3,060,448,500.Originally published on Teucrium.com
For more news, information, and analysis, visit the Commodities Channel.

