

What’s a valuable way to assess the performance of an investment strategy? By looking not only at how it performs when the market is up, but how it reacts to inevitable downturns. With that in mind, we looked at the market’s worst drawdowns since the S&P 500® Dividend Aristocrats® Index’s inception in 2005. Then we looked at subsequent performance when the market recovered.
Dividend Aristocrats typically outperformed in drawdowns—and rebounds
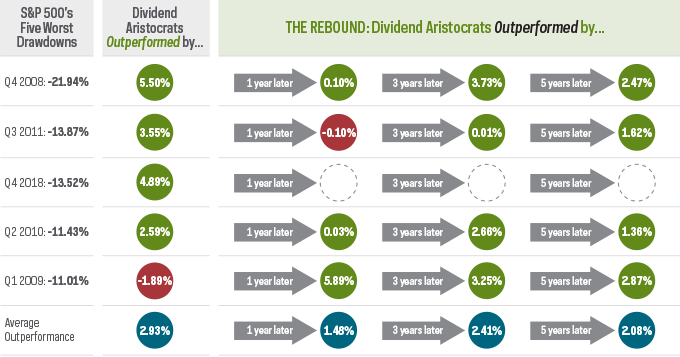
Here’s what the data show about this group of companies, each of which has demonstrated an impressive 25+ consecutive years of dividend growth to be considered a Dividend Aristocrat. The first column shows the S&P 500’s worst drops, starting with the fourth quarter of 2008.
The second column shows how much the Dividend Aristocrats over or underperformed—in all but one instance, they outperformed.
Then, we track how the Dividend Aristocrats performed as the market rebounded. As the third column shows, these elite dividend growers outperformed the S&P 500 almost across the board one, three and five years after a given drawdown.
S&P 500 Dividend Aristocrats Index vs. S&P 500
Worst Drawdowns, and Subsequent Rebounds (May 2005 – December 2018)
The takeaway: NOBL’s strategy showed resiliency when markets declined
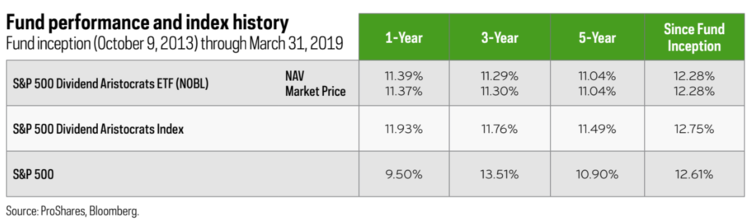
If you’re looking for high-quality large-cap stocks that have demonstrated a history of weathering market turbulence, consider ProShares S&P 500® Dividend Aristocrats® ETF (NOBL). Many investors have come to expect outperformance of dividend growth strategies during periods of market stress.
But perhaps even more impressive is that NOBL’s index outperformed the market in 11 of 12 subsequent periods from the index’s inception in 2005 to year end 2018. See daily performance and holdings for ProShares S&P 500® Dividend Aristocrats® ETF (NOBL).
Find out more
Visit ProShares.com or consult your financial advisor.
NOBL’s total operating expenses are 0.35%. The performance quoted represents past performance and does not guarantee future results. Investment return and principal value of an investment will fluctuate so that an investor’s shares, when sold or redeemed, may be worth more or less than the original cost. Shares are bought and sold at market price (not NAV) and are not individually redeemed from the fund. Market price returns are based upon the midpoint of the bid/ask spread at 4:00 p.m. ET (when NAV is normally determined for most funds) and do not represent the returns you would receive if you traded shares at other times. Brokerage commissions will reduce returns. Current performance may be lower or higher than the performance quoted. Standardized returns and performance data current to the most recent month end, see Performance.
This information is not meant to be investment advice. There is no guarantee dividends will be paid. Companies may reduce or eliminate dividends at any time, and those that do will be dropped from the indexes at reconstitution.
Investing involves risk, including the possible loss of principal. This ProShares ETF is diversified and entails certain risks, including imperfect benchmark correlation and market price variance, that may decrease performance. Please see summary and full prospectuses for a more complete description of risks. There is no guarantee any ProShares ETF will achieve its investment objective.
Carefully consider the investment objectives, risks, charges and expenses of ProShares before investing. This and other information can be found in their summary and full prospectuses. Read them carefully before investing. Obtain them from your financial advisor or broker dealer representative or visit ProShares.com.
The “S&P 500® Dividend Aristocrats® Index” is a product of S&P Dow Jones Indices LLC and its affiliates and has been licensed for use by ProShares. “S&P®” is a registered trademark of Standard & Poor’s Financial Services LLC (“S&P”) and “Dow Jones®” is a registered trademark of Dow Jones Trademark Holdings LLC (“Dow Jones”) and have been licensed for use by S&P Dow Jones Indices LLC and its affiliates. ProShares have not been passed on by these entities and their affiliates as to their legality or suitability. ProShares based on these indexes are not sponsored, endorsed, sold or promoted by these entities and their affiliates, and they make no representation regarding the advisability of investing in ProShares. THESE ENTITIES AND THEIR AFFILIATES MAKE NO WARRANTIES AND BEAR NO LIABILITY WITH RESPECT TO PROSHARES.
ProShares are distributed by SEI Investments Distribution Co., which is not affiliated with the funds’ advisor.

