ETFdb Logo
  • ETF Database
  • Content Hubs
    • Themes
      • Active ETF
      • Alternatives
      • Artificial Intelligence
      • China Insights
      • Core Strategies
      • Crypto
      • Disruptive Technology
      • Energy Infrastructure
      • ETF Building Blocks
      • ETF Investing
      • ETF Strategist
      • Financial Literacy
      • Fixed Income
      • Free Cash Flow
      • Future ETFs
      • Innovative ETFs
      • Institutional Income Strategies
      • Leveraged & Inverse
      • Market Insights
      • Market Outlooks
      • Modern Alpha
      • Nuclear Energy
      • Portfolio Strategies
      • Sector Investing
      • Tax Efficient Income
      • Thematic Investing
    • Asset Class
      • Equity
        • U.S. Equity
        • Int'l Developed
        • Emerging Market Equities
      • Alternatives
        • Gold/Silver/Critical Materials
        • Cryptocurrency
        • Currency
        • Volatility
      • Fixed Income
        • Investment Grade Corporates
        • US Treasuries & TIPS
        • High Yield Corporates
        • Int'l Fixed Income
    • ETF Ecosystem
    • ETFs in Canada
    • Market Outlook
    • Crypto ETF Hub
  • Tools
    • ETF Screener
    • ETF Country Exposure Tool
    • ETF Database Categories
    • Indexes
    • Scenario Analysis
    • Watchlists
    • Head-To-Head ETF Comparison Tool
    • Mutual Fund To ETF Converter
    • ETF Stock Exposure Tool
    • ETF Issuer Fund Flows
  • Research
    • ETF Education
    • Equity Investing
    • Dividend ETFs
    • Leveraged ETFs
    • Inverse ETFs
    • Index Education
    • Index Insights
    • Top ETF Sectors
    • Top ETF Issuers
    • Top ETF Industries
  • Webcasts
  • Sectors
    • Sector Investing Content Hub
    • XLK
    • XLI
    • XLU
    • XLY
    • XLP
    • XLRE
    • Sector Power Rankings
    • XLE
    • XLC
    • XLF
    • XLV
    • XLB
  • Multimedia
    • ETF 360 Video Series
    • ETF of the Week Podcast
    • Gaining Perspective Podcast
    • ETF Prime Podcast
    • Video
  • Company
    • About VettaFi
    • Get VettaFi’ed
  • PRO
    • Pro Content
    • Pro Tools
    • Advanced
    • FAQ
    • Free sign up
    • Login
  1. Core Equity Content Hub
  2. Global ETFs, ETPs Industry Reach Record $5.74 Trillion
Core Equity Content Hub
Share

Global ETFs, ETPs Industry Reach Record $5.74 Trillion

Aaron NeuwirthAug 13, 2019
2019-08-13

ETFGI, an independent research, and consultancy firm in the global ETFs/ETPs world, reported this week on the gathered net inflows from ETFs and ETPs for July, and a notable record was achieved.

The net inflow amounts to $60.19 billion, with a 1.7% increase in assets invested in the global ETF/ETF industry from June. The year-to-date inflows are now at $269.73 billion, with the assets invested in the global ETF/ETP industry now at $5.74 trillion, a new record.

Based on the report by Deborah Fuhr, managing partner, founder, and owner of ETFGI, “The S&P 500 gained 1.4% in July, as strong earnings combined with signs of economic growth and expectations of a rate cut by the Federal Reserve supported equity gains. International markets posted losses, with the S&P Developed Ex-U.S. and the S&P Emerging BMI both down 1%, with headwinds including U.S. dollar strength.”

In regards to other significant events covered by the report, “Boris Johnson began his term as U.K. Prime Minister with demands for a renegotiation of the E.U. withdrawal agreement, issuing a threat to otherwise leave without one.” As a result, Pound sterling (GBP) fell to near its lowest in two years.

ETFGI Chart for years up to 2019

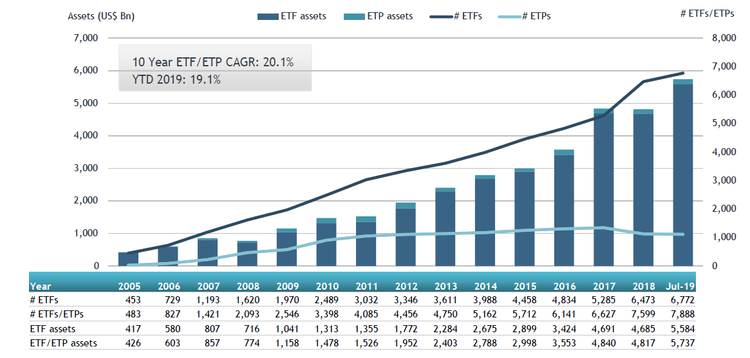
Moving forward, at the end of July 2019, with 7,888 ETFs/ETPs and 15,859 listings, the $5.74 trillion worth of assets stem from 421 providers listed on 72 exchanges in 58 countries.

In regards to the $60.19 billion in ETFs/ETPs gathered in July, Globally-listed Fixed income ETFs/ETPs brought in net inflows of $18.48 billion, bringing the net inflows for 2019 to $131.74. This is significantly higher than the $59.49 billion brought in 2018.

On the other hand, Globally-listed Equity ETFs/ETPs attracted net inflows of $35.76 billion in July, bringing the net inflows for 2019 to $114.53, down from the $176.81 brought in 2018.

And lastly, Commodity ETFs/ETPs took in $4.27 billion, bringing the net inflows to 7.77 billion for 2019, which is a sizable increase from the $2.36 gathered in 2018.

The top 20 ETFs by net new assets account for the considerable inflows, which brought in $31.05 billion in July. Notably, the SPDR S&P 500 ETF Trust (SPY A-) gathered $4.08 billion alone.


Content continues below advertisement

The top 20 ETFs

$4.21 billion was gathered in July by the top 10 ETPs by net new assets. Here, SPDR Gold Shares (GLD B) gathered $1.35 billion alone.

The top 10 ETPs

As made clear by the report, “Investors have tended to invest in Equity/Fixed Income ETFs in July.”

For more market trends, visit ETFdb.

Loading Articles...

Advertisement

Is Your Portfolio Positioned With Enough Global Exposure?

ETF Education Channel

How to Allocate Commodities in Portfolios

Tom LydonApr 26, 2022
2022-04-26

A long-running debate in asset allocation circles is how much of a portfolio an investor should...

Core Strategies Channel

Why ETFs Experience Limit Up/Down Protections

Karrie GordonMay 13, 2022
2022-05-13

In a digital age where information moves in milliseconds and millions of participants can transact...

}
X