ETFdb Logo
  • ETF Database
  • Content Hubs
    • Themes
      • Active ETF
      • Alternatives
      • Artificial Intelligence
      • China Insights
      • Core Strategies
      • Crypto
      • Disruptive Technology
      • Energy Infrastructure
      • ETF Building Blocks
      • ETF Investing
      • ETF Strategist
      • Financial Literacy
      • Fixed Income
      • Free Cash Flow
      • Future ETFs
      • Innovative ETFs
      • Institutional Income Strategies
      • Leveraged & Inverse
      • Market Insights
      • Market Outlooks
      • Modern Alpha
      • Nuclear Energy
      • Portfolio Strategies
      • Sector Investing
      • Tax Efficient Income
      • Thematic Investing
    • Asset Class
      • Equity
        • U.S. Equity
        • Int'l Developed
        • Emerging Market Equities
      • Alternatives
        • Gold/Silver/Critical Materials
        • Cryptocurrency
        • Currency
        • Volatility
      • Fixed Income
        • Investment Grade Corporates
        • US Treasuries & TIPS
        • High Yield Corporates
        • Int'l Fixed Income
    • ETF Ecosystem
    • ETFs in Canada
    • Market Outlook
    • Crypto ETF Hub
  • Tools
    • ETF Screener
    • ETF Country Exposure Tool
    • ETF Database Categories
    • Indexes
    • Scenario Analysis
    • Watchlists
    • Head-To-Head ETF Comparison Tool
    • Mutual Fund To ETF Converter
    • ETF Stock Exposure Tool
    • ETF Issuer Fund Flows
  • Research
    • ETF Education
    • Equity Investing
    • Dividend ETFs
    • Leveraged ETFs
    • Inverse ETFs
    • Index Education
    • Index Insights
    • Top ETF Sectors
    • Top ETF Issuers
    • Top ETF Industries
  • Webcasts
  • Sectors
    • Sector Investing Content Hub
    • XLK
    • XLI
    • XLU
    • XLY
    • XLP
    • XLRE
    • Sector Power Rankings
    • XLE
    • XLC
    • XLF
    • XLV
    • XLB
  • Multimedia
    • ETF 360 Video Series
    • ETF of the Week Podcast
    • Gaining Perspective Podcast
    • ETF Prime Podcast
    • Video
  • Company
    • About VettaFi
  • PRO
    • Pro Content
    • Pro Tools
    • Advanced
    • FAQ
    • Free sign up
    • Login
  1. Energy Infrastructure Content Hub
  2. 2022 vs. 2014: Energy’s Recent Strength in Context
Energy Infrastructure Content Hub
Share

2022 vs. 2014: Energy’s Recent Strength in Context

Stacey Morris, CFAJun 16, 2022
2022-06-16

Earlier this month, Exxon’s (XOM) share price closed above $100 for the first time since 2014. That was also the same year that oil prices last saw $100 per barrel prior to the rally in recent months. Today, oil prices are well above their high watermark from June 2014, but the same is not true for energy subsectors.

The chart below compares June 2022 highs (blue dots) with 2014 highs, which are set at 100% (orange line). For example, the recent high for oilfield services represented only 28.4% of the sector’s June 2014 high. In other words, the oilfield services index was recently trading more than 70% below the high experienced in June 2014, even though oil prices today are higher than in 2014. At the other extreme, Chevron’s (CVX) recent high is more than 30% above its high notched in July 2014.

2022 vs. 2014: Energy’s Recent Strength in Context

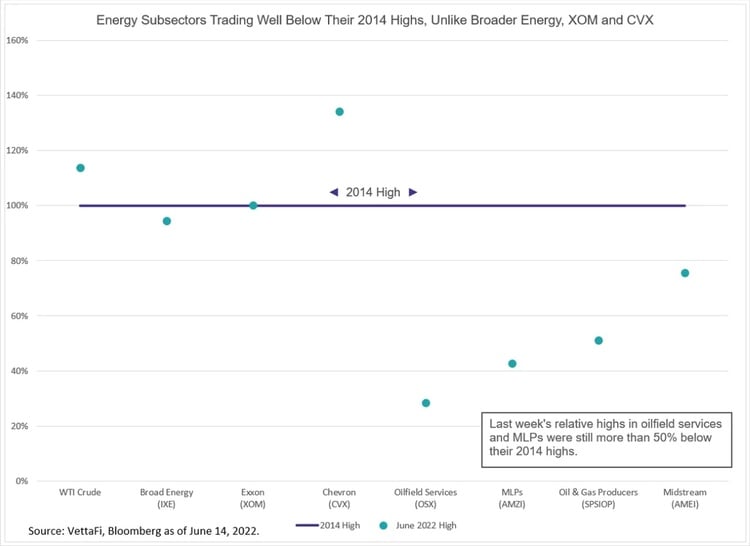
What Does This Chart Tell Investors?

Investors that have seen year-to-date gains in their energy holdings of 30%, 50%, or even more following a strong year in 2021 may be wondering if the space has run too far, too fast. For investors thinking about taking profits, this chart may provide helpful perspective. Recent price appreciation should be viewed in the context of several years of underperformance over the last decade.

Last week, broad energy, represented by the Energy Select Sector Index (IXE), was trading just shy of its high from 2014, while subsector indexes were not even close to their 2014 highs. Keep in mind that Exxon and Chevron represent approximately 23% and 20% of the IXE by weighting, respectively. Arguably, these names have disproportionately benefitted as investors adjust their portfolios to replicate energy’s greater weighting in broad market indexes — currently at 5.1% of the S&P 500 compared to 2.7% at year-end 2021. Additionally, these companies are benefitting from strong environments in both their upstream and downstream business lines. These factors have likely contributed to the strength in these names.

In short, energy investors, especially those with positions focused on certain subsectors like oilfield services, MLPs, or oil and gas producers should view last week’s relative highs in context. For those considering adding energy exposure, the pullback since June 8 may have created a compelling entry point.

For more on energy subsectors, please join our 30-minute LiveCast next week, or for more on allocating to energy, please see this note.

For more news, information, and strategy, visit the Energy Infrastructure Channel.


Content continues below advertisement

Loading Articles...

Advertisement

Is Your Portfolio Positioned With Enough Global Exposure?

ETF Education Channel

How to Allocate Commodities in Portfolios

Tom LydonApr 26, 2022
2022-04-26

A long-running debate in asset allocation circles is how much of a portfolio an investor should...

Core Strategies Channel

Why ETFs Experience Limit Up/Down Protections

Karrie GordonMay 13, 2022
2022-05-13

In a digital age where information moves in milliseconds and millions of participants can transact...

}
X