

Summary:
- By combining buyback and dividend yields, investors can get a better sense of total shareholder yields for MLPs/midstream.
- Dividends remain the primary method for returning capital in the energy infrastructure sector, with payouts poised for continued growth.
- Buyback strategies vary across the space, with aggregate MLP repurchases shrinking while broader midstream buybacks reached multi-year highs driven by Cheniere.
Total shareholder yields combine dividends and buybacks to create a more complete view of returns to shareholders. Backed by stable cash flows from fee-based businesses, the energy infrastructure sector
continues to rely on dividends as its primary method of returning capital to investors. Since an inflection in free cash flow in 2020-21, companies have also supported shareholder returns with buybacks. This
note examines the total shareholder yield at the index level for MLPs and changes over the last few years. (See recent notes on dividends and buybacks for company-level details.)
Examining MLP/Midstream Shareholder Yields
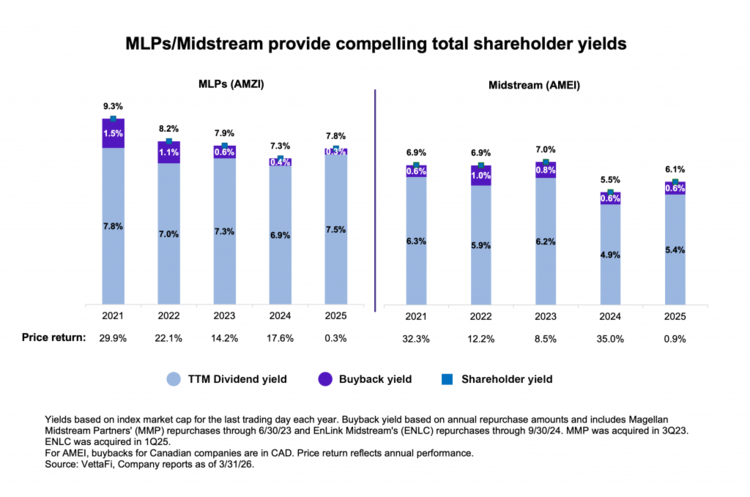
While admittedly backwards-looking, total shareholder yields can be helpful context and highlight trends over time. The chart below shows the trailing 12-month (TTM) dividend yields and buyback yields for the
Alerian MLP Infrastructure Index (AMZI) and the Alerian Midstream Energy Select Index (AMEI) at the end of each year. AMEI, which is 75% US and Canadian midstream C-Corps and 25% MLPs, is used to
represent broader midstream. Buybacks, including share repurchases from parent companies, are based on full-year repurchases from annual reports.
The chart also includes annual index price returns, as important context to yield data. Index market cap, the denominator in the yield calculation, increased throughout the periods shown, which puts downward pressure on yields. In 2025, midstream took a breather and ended the year largely flat (read more). This, combined with dividend growth, resulted in higher yields at the end of the year. The text below digs more into the data for MLPs and broader midstream.
MLPs: Yields Rebound on Strong Distribution Growth as Buybacks Shrink
After a dip in 2024, due to strong price performance, the TTM dividend (distribution) yield for AMZI rebounded to 7.5% in 2025. This increase was driven by 9.8% normalized distribution growth for AMZI
for the year, paired with a relatively flat price return. With last year’s TTM dividend yield the highest since 2021, it’s clear that MLPs have prioritized distribution growth. Double-digit percentage increases
for select names and consistent growth from others have maintained the group’s attractive income profile. Based on the latest payouts announced in 1Q26, 89.4% of AMZI by weighting increased distributions on a year-over-year basis (read more).
For AMZI, aggregate buybacks have fallen each year since 2021, while index market cap has increased. MLP buybacks fell from $990 million in 2024 to $788 million in 2025, resulting in a fairly negligible buyback yield of 0.3% at the index level. Repurchases in 2025 primarily came from MPLX (MPLX) and Enterprise Products Partners (EPD) at $400 million and $300 million, respectively. EPD upsized its buyback authorization from $2 billion to $5 billion towards the end of 2025 and plans to allocate 55-60% of its estimated 2026 discretionary free cash flow toward programmatic and opportunistic repurchases. While 73.2% of AMZI by weighting has a buyback authorization as of March 31, MLPs broadly favor distributions for capital returns.
Midstream: 2025 Dividend Yield Gains, While Buyback Yield Roughly Flat
growth for AMEI constituents, paired with a muted price return of 0.9% for the year. Meanwhile, aggregate buybacks climbed to multi-year highs, largely supported by Cheniere Energy’s (LNG) $2.7 billion in buyback spend for the year.
Unlike the MLP space, broader midstream buybacks have been more consistent in aggregate. AMEI’s buyback yield held steady at 0.6% for 2025, matching its 2024 level, while overall repurchases for AMEI
constituents increased to $4.5 billion from $4.2 billion in 2024. Of note, Cheniere’s Board approved an incremental $9 billion in repurchase authorization in February, bringing its total buyback authorization to over $10 billion through 2030. Cheniere’s hefty repurchases have helped offset reduced repurchase activity from companies working through large backlogs for natural gas pipelines and infrastructure (read more).
Similar to MLPs, broader midstream largely prioritizes growing dividends. Based on the latest dividend announcements in 1Q26, 90.1% of AMEI by weighting increased dividends on a year-over-year basis.
Bottom Line
Index-level dividend and buyback yields can provide valuable context for investors focused on total shareholder returns in the MLP and broader midstream space. For 2025, robust dividend growth and steady buybacks pushed total shareholder yields higher as indexes were roughly flat on a price-return basis.
Looking for midstream insights in your inbox? Subscribe here to keep a pulse on midstream investing through our weekly updates.
AMZI is the underlying index for the Alerian MLP ETF (AMLP) and the ETRACS Alerian MLP Infrastructure Index ETN Series B (MLPB). AMEI is the underlying index for the Alerian Energy Infrastructure ETF (ENFR) and the Alerian Energy Infrastructure Portfolio (ALEFX).
Related Research:
Strong 4Q25 Caps Record Year for Midstream/MLP Buybacks
Broad-Based Growth in 4Q25 Midstream/MLP Dividends
Delving into MLP/Midstream Total Shareholder Yield
Breaking Down Midstream/MLP Performance for 2025
Breaking Down MLP Distribution Outlooks With AMZI
Examining MLP/Midstream Dividend and Buyback Yields
Surging U.S. Power Needs Drive Gas Infrastructure Opportunity
Vettafi.com is owned by VettaFi LLC (“VettaFi”). VettaFi is the index provider for AMLP, MLPB, ENFR, and ALEFX, for which it receives an index licensing fee. However, AMLP, MLPB, ENFR, and ALEFX are not issued, sponsored, endorsed or sold by VettaFi, and VettaFi has no obligation or liability in connection with the issuance, administration, marketing or trading of AMLP, MLPB, ENFR, and ALEFX.
For more news, information, and analysis, visit the Energy Infrastructure Content Hub.

