


July 1 carries a particular significance for many liquids pipelines in the U.S. Each year on this date, these pipelines are able to adjust their rates using an index based on inflation. This July marks the first adjustment with a new five-year level for the index. Today’s note provides an overview of the Oil Pipeline Index and why it matters for midstream, especially in periods of inflation.
Key Takeaways
- Liquids pipelines and other assets following FERC’s Oil Pipeline Index could increase rates by up to 1.43% on July 1.
- The increase for July 2026 was the smallest of the last five years. However, rising inflation could drive a more noticeable increase for July 2027.
- Whether based on the FERC index or another metric, long-term midstream contracts typically include an annual inflation adjustment. This and real asset exposure helps midstream/MLPs perform well in periods of inflation.
What Is the Oil Pipeline Index?
The Oil Pipeline Index is overseen by the Federal Energy Regulatory Commission (FERC). FERC is tasked with ensuring that interstate pipeline rates are just and reasonable for both oil and natural gas. Many pipelines that transport liquids (oil, natural gas liquids, refined products like gasoline and diesel) use the FERC’s index, which sets the ceiling for annual rate changes. As discussed more below, other assets use the FERC index as well. The index is based on the Producer Price Index for Finished Goods (PPI-FG) with an adjustment.
The Oil Pipeline Index is reviewed every five years to ensure that: 1) it appropriately reflects changes in industry costs, and 2) rates remain just and reasonable. The industry-wide index was established in the 1990s to help avoid cumbersome cost-of-service filings and litigation for individual pipelines.
In April, FERC announced that the index would be based on PPI-FG – 0.55% for the next five years beginning with July 1, 2026. For the midstream industry, this marked a better outcome than the initial index level of PPI-FG – 1.42% that was proposed back in November 2025. In short, annual rate adjustments will be based on inflation, modestly tracking below the change in PPI-FG.
What Was the Rate Adjustment for 2026? How Does It Compare to Recent Years?
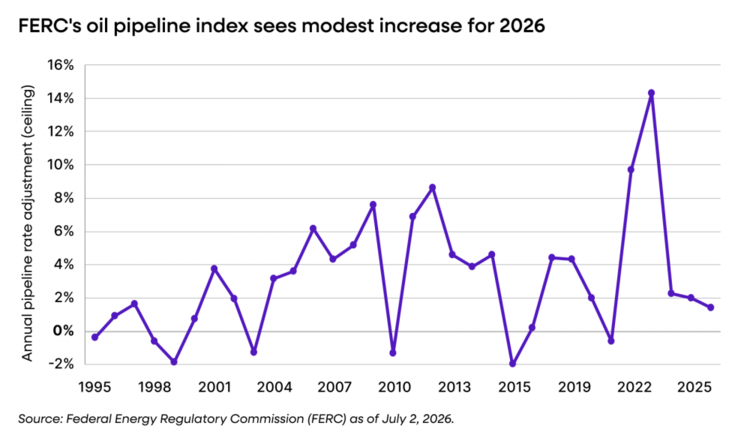
The change in PPI-FG for 2025 is used in the formula to calculate the rate adjustment for 2026. For 2025, PPI-FG increased by 1.979%. Therefore, pipelines following the index were able to increase their rates by up to 1.429% on July 1 (1.979% – 0.55%).
The chart below shows the annual rate changes as outlined by the FERC’s Oil Pipeline Index since 1995. Notably, 2023 saw a record-high adjustment of 14.3% reflecting soaring inflation in 2022. For 2024 and 2025, the adjustments were more modest at around 2%. The ceiling rate increase for July 2026 marks the lowest increase of the last five years. With inflation heating up again, there may be a more noticeable increase for July 2027.
So What?
Certainly, the pipeline index is important for the 195 FERC-regulated pipelines that rely on the index for ratemaking. However, the impact for midstream is broader. Many midstream assets outside of FERC’s jurisdiction incorporate the index into contracts to ensure their rates are adjusting with inflation. Intrastate pipelines (regulated by states), terminals, and storage facilities may rely on the index for annual rate adjustments.
It is also worth noting that liquids pipelines do not have to follow the FERC index. Some liquids pipelines use market-based or negotiated rates, where the pipeline provider and customer essentially agree to a certain rate. ONEOK (OKE) said on their 1Q26 earnings call that 70% of the volume in their Refined Product and Crude segment used market-based rates, instead of the FERC index.
Importantly, whether assets use the FERC index or not, long-term midstream contracts typically include an annual inflation adjustment. As just one example, Enterprise Products Partners (EPD) "highlights":https://ir.enterpriseproducts.com/static-files/4ff3a105-b324-404f-bdf2-5bc4e9771b39 that approximately 90% of its long-term contracts include escalation provisions to limit the impact of inflation on cash flows and distributions. In addition to real asset exposure, this factor also contributes to midstream/MLPs typically holding up well in periods of inflation.
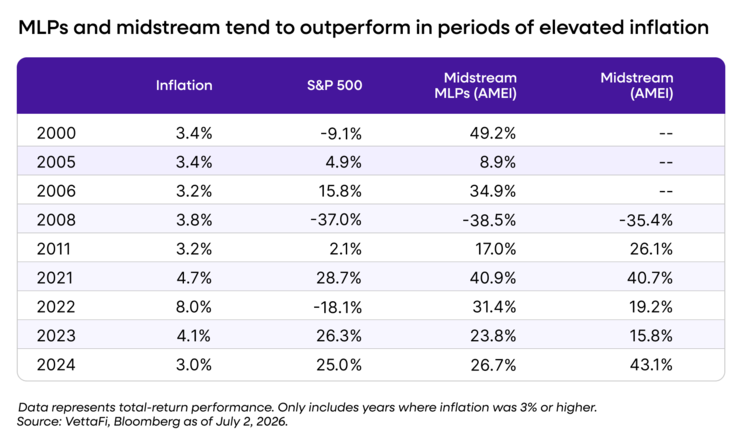
As shown below, MLPs represented by the Alerian MLP Infrastructure Index (AMZI) and broader midstream represented by the Alerian Midstream Energy Select Index (AMEI) tend to outperform in periods of elevated inflation. Specifically, AMZI outperformed the S&P 500 on a total-return basis in seven of the nine years since 2000 when inflation has exceeded 3%. AMEI has less history but outperformed the S&P 500 in five of the six years shown.
Bottom Line:
The FERC Oil Pipeline Index provides one relevant example of the inflation protection built into midstream cash flows. Annual inflation adjustments in contracts and the real asset exposure in the space have historically been supportive for midstream/MLP performance in periods of elevated inflation.
Related Research:
Real Assets May Be the Missing Piece in Portfolios
2026 EBITDA Guidance Reinforces Midstream Stability
It’s July 1 & US Liquids Pipelines Are Raising Rates
Looking for midstream insights in your inbox? "Subscribe here to keep a pulse on midstream investing through our weekly updates.":https://offer.vettafi.com/subscribe-energy-insights?hstc=169852158.04a34d5394a0a58d714617802d62a8d7.1724079302216.1755523495651.1755530279926.616&hssc=169852158.4.1755530279926&__hsfp=3537862647
For more news, information, and analysis, visit the Energy Infrastructure Content Hub.
AMZI is the underlying index for the Alerian MLP ETF (AMLP) and the ETRACS Alerian MLP Infrastructure Index ETN Series B (MLPB). AMEI is the underlying index for the Alerian Energy Infrastructure ETF (ENFR) and the Alerian Energy Infrastructure Portfolio (ALEFX).
vettafi.com is owned by VettaFi LLC (“VettaFi”). VettaFi is the index provider for AMLP, MLPB, ENFR, and ALEFX, for which it receives an index licensing fee. However, AMLP, MLPB, ENFR, and ALEFX are not issued, sponsored, endorsed or sold by VettaFi, and VettaFi has no obligation or liability in connection with the issuance, administration, marketing or trading of AMLP, MLPB, ENFR, and ALEFX.

