

Last week’s data reaffirmed that inflation pressures remain the defining narrative across the economic landscape. While finalized data reveals that economic growth expanded at a surprisingly strong pace back in the first quarter, more recent data points to broadening price pressures throughout the economy. These persistent costs are keeping consumer sentiment pinned near historic lows despite a modest rebound, leaving equity markets on edge as investors anticipate a highly cautious path forward from the Federal Reserve.
Key Takeaways
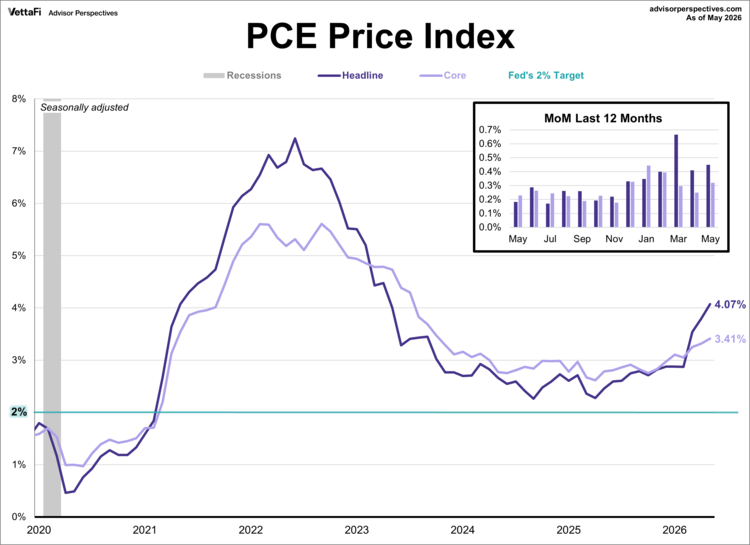
- The core PCE price index rose 3.4% in May, its highest level since October 2023.
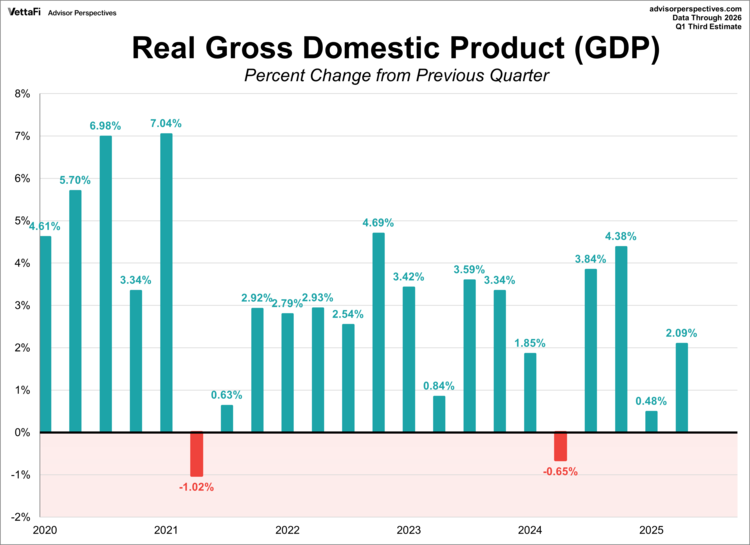
- Real GDP grew at a 2.1% annualized rate in the first quarter of 2026, exceeding forecasts.
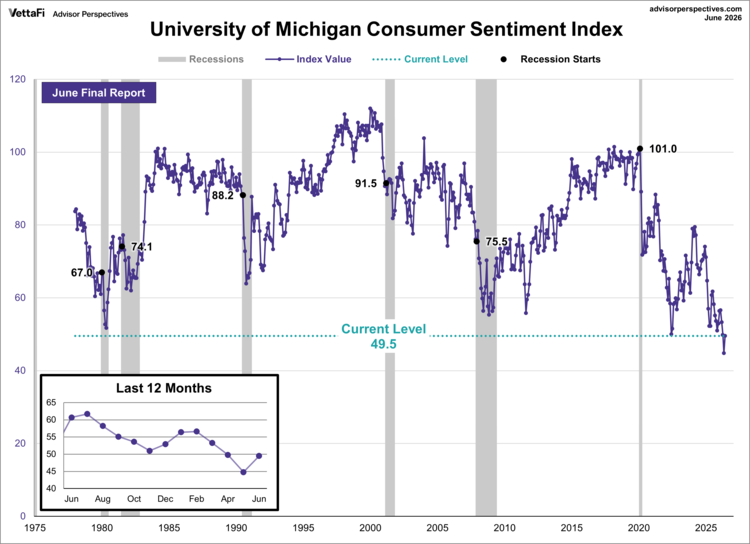
- The Michigan Consumer Sentiment Index rose 10.5% in June to 49.5, breaking a four-month decline.
PCE Price Index
The Federal Reserve’s preferred inflation gauge continued to climb in May, driven higher by energy costs stemming from the conflict in the Middle East. The headline PCE price index 0.4% from the previous month and 4.1% year-over-year, marking its highest annual pace since April 2023. Meanwhile, core PCE, which excludes volatile food and energy prices, advanced 0.3% monthly and reached a 3.4% annual rate, its highest level since October 2023. While the conflict’s direct impact is most visible in these elevated headline numbers, the continued rise in core inflation underscores that price pressures are broadening throughout the wider economy. Although a recently signed peace deal has already driven gasoline prices lower, it remains to be seen whether these broader underlying pressures will persist in the coming months.
Gross Domestic Product (GDP)
U.S. economic growth accelerated sharply at the start of 2026, outperforming earlier projections. Real GDP at a 2.1% annualized rate in the first quarter, according to the BEA’s third estimate, marking a significant rebound from the 0.5% growth in the final quarter of 2025. This final print beat the forecast of 1.6%, with the expansion largely fueled by increase in business investment, exports, government spending, and consumer spending.
Consumer Sentiment
Consumer sentiment snapped a three-month decline in June, rising for the first time in four months, though it remains near historic lows as inflation continues to burden households. The final University of Michigan Consumer Sentiment Index came in at 49.5, marking a 10.5% rebound from May’s record low and outperforming the preliminary reading of 48.9. The uptick was broad-based across income levels, wealth tiers, and political affiliations.
While moderating gasoline prices some relief and helped boost morale, consumers continued to mention concerns around cost of living. One-year inflation expectations dropped from 4.8% in May to 4.6%, while five-year expectations fell from 3.9% to 3.3%. Despite the cooling, both readings remain higher than those from a few years ago.
The Consumer Discretionary Select Sector SPDR ETF (XLY ) is tied to consumer sentiment.
Market Reactions and Fed Outlook
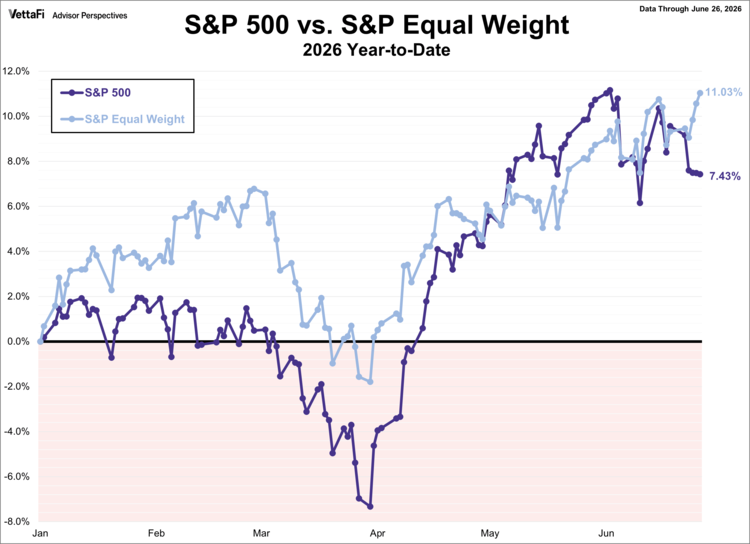
The S&P 500 every day last week, its longest losing streak since last August. Ultimately, the index closed the week down 2.0%, marking its first decline in three weeks. As a result, the SPDR S&P 500 ETF Trust (SPY ) fell 2.2% last week. Meanwhile, the S&P Equal Weight Index was up 1.6% from the previous week and the Invesco S&P 500® Equal Weight ETF (RSP ) rose 1.2%.
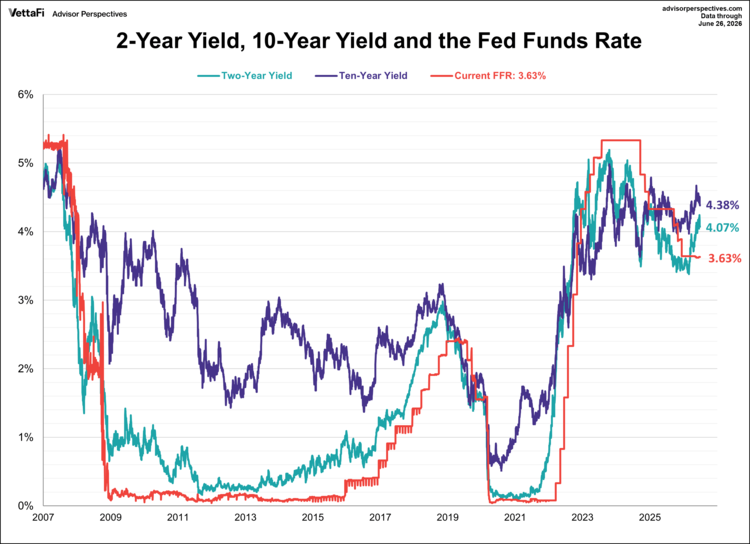
The 10-year Treasury yield the week at 4.38%, while the 2-year note finished at 4.07%.
The CME FedWatch Tool currently indicates a 70% chance that the Fed will hold rates steady at its late-July meeting, compared to a 30% probability of a 25 basis point hike. Looking further ahead, markets are pricing in a rate hike in September, followed by a pause through the end of 2027.
Looking Ahead: Economic Data for the Week of June 29, 2026
- Monday: Dallas Fed Manufacturing Index (June)
- Tuesday: JOLTS Job Openings (May), Conference Board Consumer Confidence Index (June), S&P Case-Shiller Home Price Index (April), FHFA Home Price Index (April), Chicago PMI (June)
- Wednesday: S&P Global Manufacturing PMI (June), ISM Manufacturing PMI (May), ADP Employment Report (June)
- Thursday: Weekly Jobless Claims, BLS Employment Report (June)
- Friday: Holiday – no data
Originally published Advisor Perspectives
For more news, information, and analysis, visit the Equity ETF Content Hub.

