ETFdb Logo
  • ETF Database
  • Content Hubs
    • Themes
      • Active ETF
      • Alternatives
      • Artificial Intelligence
      • China Insights
      • Core Strategies
      • Crypto
      • Disruptive Technology
      • Energy Infrastructure
      • ETF Building Blocks
      • ETF Investing
      • ETF Strategist
      • Financial Literacy
      • Fixed Income
      • Free Cash Flow
      • Future ETFs
      • Innovative ETFs
      • Institutional Income Strategies
      • Leveraged & Inverse
      • Market Insights
      • Market Outlooks
      • Modern Alpha
      • Nuclear Energy
      • Portfolio Strategies
      • Sector Investing
      • Tax Efficient Income
      • Thematic Investing
    • Asset Class
      • Equity
        • U.S. Equity
        • Int'l Developed
        • Emerging Market Equities
      • Alternatives
        • Gold/Silver/Critical Materials
        • Cryptocurrency
        • Currency
        • Volatility
      • Fixed Income
        • Investment Grade Corporates
        • US Treasuries & TIPS
        • High Yield Corporates
        • Int'l Fixed Income
    • ETF Ecosystem
    • ETFs in Canada
    • Market Outlook
    • Crypto ETF Hub
  • Tools
    • ETF Screener
    • ETF Country Exposure Tool
    • ETF Database Categories
    • Indexes
    • Scenario Analysis
    • Watchlists
    • Head-To-Head ETF Comparison Tool
    • Mutual Fund To ETF Converter
    • ETF Stock Exposure Tool
    • ETF Issuer Fund Flows
  • Research
    • ETF Education
    • Equity Investing
    • Dividend ETFs
    • Leveraged ETFs
    • Inverse ETFs
    • Index Education
    • Index Insights
    • Top ETF Sectors
    • Top ETF Issuers
    • Top ETF Industries
  • Webcasts
  • Sectors
    • Sector Investing Content Hub
    • XLK
    • XLI
    • XLU
    • XLY
    • XLP
    • XLRE
    • Sector Power Rankings
    • XLE
    • XLC
    • XLF
    • XLV
    • XLB
  • Multimedia
    • ETF 360 Video Series
    • ETF of the Week Podcast
    • Gaining Perspective Podcast
    • ETF Prime Podcast
    • Video
  • Company
    • About VettaFi
  • PRO
    • Pro Content
    • Pro Tools
    • Advanced
    • FAQ
    • Free sign up
    • Login
  1. ETF Building Blocks Content Hub
  2. Scary Valuations? Finding Growth at a Reasonable Price
ETF Building Blocks Content Hub
Share

Scary Valuations? Finding Growth at a Reasonable Price

Tom LydonMay 10, 2021
2021-05-10

As investors well know, there’s growth investing and there’s value investing. The concept of growth at a reasonable price (GARP) fills the gap between the two, and it’s accessible with the Barron’s 400 ETF (BFOR B).

“Some investors have sought to bridge the Value–Growth divide through a hybrid strategy, opting for the growth at a reasonable price (GARP) approach popularized by Fidelity manager Peter Lynch,” according to the CFA Institute. “But if Value creates positive excess returns, as the research demonstrates, then Growth does largely the opposite, which would seem to cast doubt on GARP’s underlying logic.”

One way of looking at that assessment is that GARP is like any other investment factor – it has pros and cons. With that being true, it can be difficult to stock pick based on GARP, underscoring the utility of BFOR’s broad-based approach.

BFOR 1 Year Return

Reasons to Bank on 'BFOR'

Another advantage of BFOR is that funds extolling the virtues of GARP often apply in different ways. There is no uniformity.

“Definitions of GARP stocks can vary but are generally based on the price/earnings (P/E) to growth ratio (PEG), which divides the P/E ratio by the growth rate. In our analysis, we derive the PEG from the P/E ratio from the last 12 months of earnings and the three-year growth rate of earnings. Stocks that exhibit a PEG ratio below 1 are classified as GARP stocks,” notes the CFA Institute.

BFOR tracks the Barron’s 400 Index (B400), which takes 400 stocks from the broader MarketGrader U.S. Coverage Universe by using a methodology that selects components based on the strength of their fundamentals in growth, valuation, profitability, and cash flow, and then screens components for certain criteria regarding concentration, market capitalization, and liquidity.

Clearly, there’s allure with BFOR’s methodology. Namely, the fund can provide investors with a basket of high earnings growth names trading at attractive valuations.

“Not only do GARP stocks show higher earnings growth than the market, but they also have lower valuations. The analysis shows median rather than average P/E multiples, which explains why the benchmark P/E multiples of all stocks are less extreme at certain periods — for example, during the tech bubble in 2000 — than in similar capital market research,” concludes the CFA Institute.

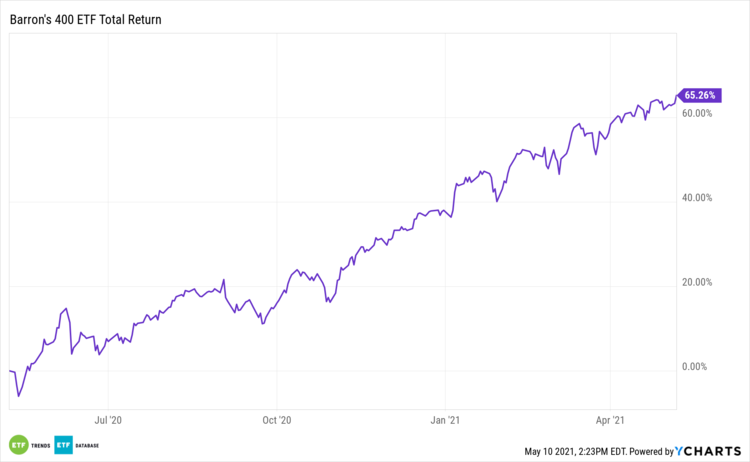
BFOR is up 20% year-to-date.

For more on cornerstone strategies, visit our ETF Building Blocks Channel.


Content continues below advertisement

Loading Articles...

Advertisement

Is Your Portfolio Positioned With Enough Global Exposure?

ETF Education Channel

How to Allocate Commodities in Portfolios

Tom LydonApr 26, 2022
2022-04-26

A long-running debate in asset allocation circles is how much of a portfolio an investor should...

Core Strategies Channel

Why ETFs Experience Limit Up/Down Protections

Karrie GordonMay 13, 2022
2022-05-13

In a digital age where information moves in milliseconds and millions of participants can transact...

}
X