ETFdb Logo
  • ETF Database
  • Content Hubs
    • Themes
      • Active ETF
      • Alternatives
      • Artificial Intelligence
      • China Insights
      • Core Strategies
      • Crypto
      • Disruptive Technology
      • Energy Infrastructure
      • ETF Building Blocks
      • ETF Investing
      • ETF Strategist
      • Financial Literacy
      • Fixed Income
      • Free Cash Flow
      • Future ETFs
      • Innovative ETFs
      • Institutional Income Strategies
      • Leveraged & Inverse
      • Market Insights
      • Market Outlooks
      • Modern Alpha
      • Nuclear Energy
      • Portfolio Strategies
      • Sector Investing
      • Tax Efficient Income
      • Thematic Investing
    • Asset Class
      • Equity
        • U.S. Equity
        • Int'l Developed
        • Emerging Market Equities
      • Alternatives
        • Gold/Silver/Critical Materials
        • Cryptocurrency
        • Currency
        • Volatility
      • Fixed Income
        • Investment Grade Corporates
        • US Treasuries & TIPS
        • High Yield Corporates
        • Int'l Fixed Income
    • ETF Ecosystem
    • ETFs in Canada
    • Market Outlook
    • Crypto ETF Hub
  • Tools
    • ETF Screener
    • ETF Country Exposure Tool
    • ETF Database Categories
    • Indexes
    • Scenario Analysis
    • Watchlists
    • Head-To-Head ETF Comparison Tool
    • Mutual Fund To ETF Converter
    • ETF Stock Exposure Tool
    • ETF Issuer Fund Flows
  • Research
    • ETF Education
    • Equity Investing
    • Dividend ETFs
    • Leveraged ETFs
    • Inverse ETFs
    • Index Education
    • Index Insights
    • Top ETF Sectors
    • Top ETF Issuers
    • Top ETF Industries
  • Webcasts
  • Sectors
    • Sector Investing Content Hub
    • XLK
    • XLI
    • XLU
    • XLY
    • XLP
    • XLRE
    • Sector Power Rankings
    • XLE
    • XLC
    • XLF
    • XLV
    • XLB
  • Multimedia
    • ETF 360 Video Series
    • ETF of the Week Podcast
    • Gaining Perspective Podcast
    • ETF Prime Podcast
    • Video
  • Company
    • About VettaFi
  • PRO
    • Pro Content
    • Pro Tools
    • Advanced
    • FAQ
    • Free sign up
    • Login
  1. ETF Education Content Hub
  2. XMLV: Shedding Volatility in the Market’s ‘Sweet Spot’
ETF Education Content Hub
Share

XMLV: Shedding Volatility in the Market's 'Sweet Spot'

Tom LydonMay 17, 2021
2021-05-17

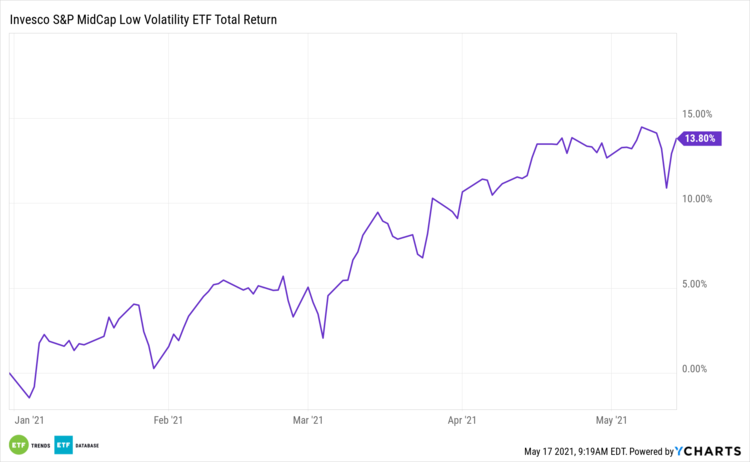
With mid caps soaring this year, volatility reduction may not be top of mind for many investors. Yet those those looking for engagement with an asset class with reduced turbulence can consider the Invesco S&P MidCap Low Volatility ETF (XMLV B+).

XMLV follows the S&P MidCap 400 Low Volatility Index, which is home to the 80 members of the S&P MidCap 400 with the lowest trailing 12-month volatility.

“Volatility is a statistical measurement of the magnitude of up and down asset price fluctuations over time,” according to Invesco.

XMLV’s mission to avoid volatility is relevant because mid caps are an ideal asset class for long-term investors.

“Mid-caps outperform: $1 in mid in 1978 equals $199 today, outperforming small-caps ($181) but especially large ($139),” according to Bank of America research.

XMLV YTD Performance

A Mid Cap Miracle?

Another point in favor of XMLV, particularly over the near-term, is that mid caps are usually responsive to GDP increases. That’s relevant as the economy emerges from the effects of the coronavirus pandemic.

“Mid-caps are more sensitive to GDP growth, with a history of outperforming large caps during economic expansions,” notes Bank of America. “The BofA US Economics team forecasts high economic growth to continue into 2022 and beyond, and we note that mid-caps have a history of outperforming large-caps during periods of faster economic growth. Our current growth outlook implies one of the best periods for mid-caps vs. large in modern history.”

It’s often said that mid caps are the market’s “sweet spot.” These same stocks are too often overlooked.

“Mid-caps have been responsible for 31% of total US corporate EPS since 1995, have been responsible for 39% of total equity market returns since 1978 and boast higher average annualized returns than large and small-caps. However, mid-caps have enjoyed less than 5% of the combined large, mid and small-cap ETF inflows. The group is under-owned relative to their economic contribution,” adds Bank of America.

Cyclical sectors, such as financial services, industrials, and materials, are expected to drive mid caps higher this year. That’s good news for XMLV because that trio combines for almost 42% of the ETF’s roster.


Content continues below advertisement

XMLV ETF Holdings

For more news, information, and strategy, visit the ETF Education Channel.

Loading Articles...

Advertisement

Is Your Portfolio Positioned With Enough Global Exposure?

ETF Education Channel

How to Allocate Commodities in Portfolios

Tom LydonApr 26, 2022
2022-04-26

A long-running debate in asset allocation circles is how much of a portfolio an investor should...

Core Strategies Channel

Why ETFs Experience Limit Up/Down Protections

Karrie GordonMay 13, 2022
2022-05-13

In a digital age where information moves in milliseconds and millions of participants can transact...

}
X