

As the United States federal government shutdown continues, the political theater in Washington has reached a fever pitch. Sparked by congressional gridlock over fiscal year 2026 appropriations, this impasse has furloughed over 775,000 federal workers and disrupted services from national parks to air traffic control. Yet, for all the headlines, the economic fallout remains remarkably contained, underscoring a key truth: the federal government’s role in the economy (impact on GDP) is far smaller than its outsized presence in public discourse might suggest.
To illustrate this point, consider the five primary economic cohorts that drive U.S. gross domestic product (GDP): households (personal consumption expenditures and residential investment, about 72% of GDP), private businesses (investment and production, roughly 14%), state and local governments (around 11%), the federal government (a modest 6% in direct spending terms (not including transfer payments such as Social Security, which are counted in household consumption)), and net trade (-3%). The federal government, while essential for defense, entitlements, and infrastructure, is overshadowed by the magnitude private sector. During the shutdown, essential functions—military operations, Social Security payments, and most healthcare programs—continue uninterrupted, insulating the economy from systemic shock. The result? Minimal drag on overall growth.
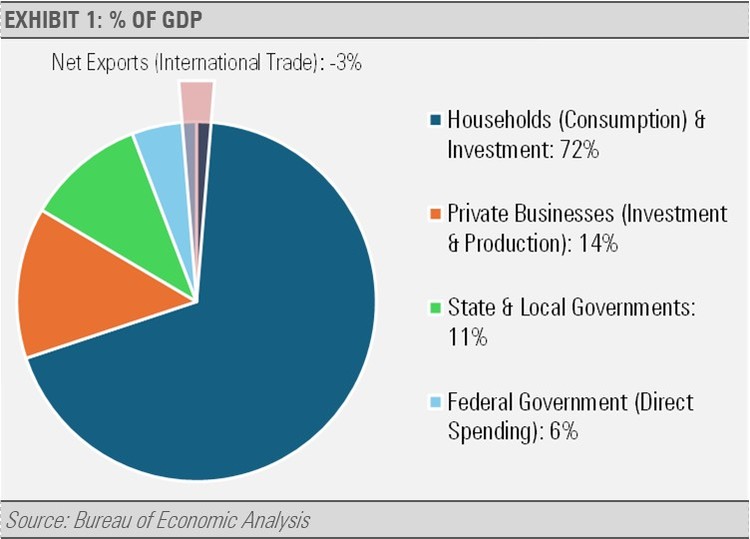
Key Notes:
Households (72%): Personal consumption expenditures and residential investment— the engine of growth.
Private Businesses (14%): Gross private domestic investment.
State & Local Governments (11%): Education, infrastructure, public safety.
Federal Government (6%): Direct spending only (excludes transfers like Social Security, which are counted in household consumption).
Net Exports (-3%): International trade.
Source: Bureau of Economic Analysis (BEA), Q2 2025 data (annualized).
While the impact on unpaid federal employees and potential SNAP benefit delays affecting 41 million low-income American households should not be taken lightly, the broader impact on GDP is relatively small.
In addition, furloughs may have some local impact in areas where government employment is more concentrated, and delayed IRS refunds could trim consumer outlays if prolonged, but these do not reach a level that would significantly impact the $29 trillion U.S. economy. Looking back at similar shutdowns and their impact provides a historical precedent. Most recently, the 2018-2019 shutdown (35 days), shaved just 0.1-0.2 percentage points off quarterly GDP growth, with full recovery upon resolution.
In 2019 amid shutdown angst, GDP grew 2%, unemployment hovered below 4%, and no downturn materialized. Today’s environment echoes that: with unemployment at 4.3% and real GDP expected to expand by 3.9% annualized in Q3 2025 according to the Atlanta Fed’s GDPNow.
This resilience stems from the federal government’s peripheral role in the broad economy. Households and businesses continue fueling demand as corporate earnings forecasts for the fourth quarter remain robust.
In short, this shutdown is less an economic crisis than a governance failure, a costly sideshow that exposes Washington’s dysfunction without derailing America’s economic engine.
For more news, information, and analysis, visit the ETF Strategist Content Hub.
DISCLOSURES
Any forecasts, figures, opinions or investment techniques and strategies explained are Stringer Asset Management, LLC’s as of the date of publication. They are considered to be accurate at the time of writing, but no warranty of accuracy is given and no liability in respect to error or omission is accepted. They are subject to change without reference or notification. The views contained herein are not to be taken as advice or a recommendation to buy or sell any investment and the material should not be relied upon as containing sufficient information to support an investment decision. It should be noted that the value of investments and the income from them may fluctuate in accordance with market conditions and taxation agreements and investors may not get back the full amount invested.
Past performance and yield may not be a reliable guide to future performance. Current performance may be higher or lower than the performance quoted.
The securities identified and described may not represent all of the securities purchased, sold or recommended for client accounts. The reader should not assume that an investment in the securities identified was or will be profitable.
Data is provided by various sources and prepared by Stringer Asset Management, LLC and has not been verified or audited by an independent accountant.

