

Part Two: Lessons from the Gold Rush for the AI Market
SUMMARY
- AI proliferation may be more similar to a ‘gold rush’ than a late-1990s ‘bubble’, in our view.
- We currently favor investing in AI infrastructure and “hyperscalers” over AI software.
- AI adoption may lead to a multi-stage bull market, rather than a classic bubble.
As discussed last week in Part One, Artificial Intelligence (‘AI’) is a natural extension of the technological innovations that began with the proliferation of the Internet over the last 30+ years. Given this connection, and the fact that many readers and investors lived through the “Internet Revolution” in the 90’s, the parallels made between today’s AI-driven market and the ‘Dot.Com’ bubble are unavoidable. We acknowledge the similarities, but also see another piece of US history that could be just as useful as an analog: the California ‘Gold Rush’. In this week’s Strategic View, we want to dig deeper (pun absolutely intended) on this comparison and see what wisdom we can ascertain about today and the near future.
A Brief History of the Gold Rush (1848-1855)
In 1848, gold is discovered in Sutter Mill and in San Francisco, and the gold rush officially began. Using simple tools such as picks and shovels, early miners arrived in mass to extract the surface-level gold. This mining was boom-or-bust; the early miners that found gold had a huge return on investment, but there were more failures than success stories.
As easily extracted gold mining opportunities began to disappear, large mining companies were formed and invested in improving the “picks and shovels” to create more modern mining techniques. This led to a wave of mining innovations that enabled more advanced extraction, which created a more consistent but lower shareholder return. Additionally, due to their size and scale, these mining companies were able to acquire more land and increase the search area for gold.
In the end, the gold rush did not actually end in a ‘bust’, in our view. While the impact of the gold extracted itself was positive, the secondary economic impacts of providing sustenance and infrastructure to a remote part of the US was more profound, as it ended up greatly expanding economic activity in the West. It is widely known that the California gold rush was more profitable for mining companies and the sellers of mining infrastructure than for the miners themselves. Perhaps less understood is that the technological advances in mining and logistics laid the groundwork for the post-Civil War expansion of the United States to become a truly continental nation.
Today's 'Silicone Rush' (2023-today)
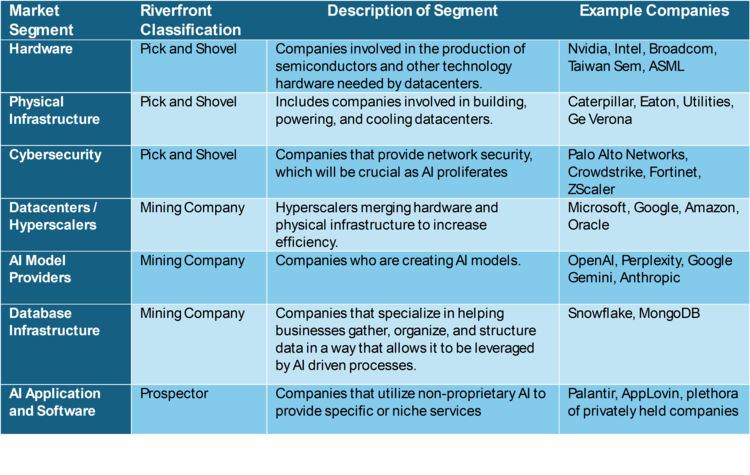
Today we see clear parallels. First, the three parties we discussed above all have modern counterparts, in our opinion:
- Today’s ‘picks and shovels’ providers are represented by the AI infrastructure companies (servers and semiconductor producers) and the industrial infrastructure companies (utilities, cooling, and power generation companies).
- The ‘mining companies’ are represented by “hyperscalers” - providers of data storage, computing and networking.
- The individual ‘prospectors’ are the companies developing today’s early AI applications.
Looking at the timeline laid out by the gold rush, we believe we are still in the early stages of AI proliferation. There are still some surface-level, high risk-and-potential return investments to be made in the early-stage AI applications, many of them speculative and often private companies. We believe that the risks for those early enterprises are akin to being a lone prospector; investments outcomes will be binary, with a lot more losers than winners. Given our more diversified ‘core’ investment philosophy, this is not the kind of speculative prognostication we feel comfortable investing in.
On the other hand, similar to the mining companies of the gold rush, the hyperscalers are currently building infrastructure that will allow for more sustainable investments in the future. We expect profits and growth to slow somewhat from here but remain robust. Investing in this side of the story aligns more with RiverFront’s stock selection process, which focuses on established profitability, earnings and valuations. The physical infrastructure companies are a needed piece of the puzzle that in our view will benefit from organic demand through the hyperscalers’ capital expenditure spending, much like the mining ecosystem of the 1890s. In the table below, we lay out seven different segments of the AI story, how they compare to the gold rush analogy, a description of the segment and some sample companies.
When looking at our current portfolio positioning, all our portfolios are overweight hardware and datacenters relative to their benchmarks, with individual stock positions in each of these segments when our models allow it. Additionally, we have broad exposure to physical infrastructure through thematic ETFs in our longer horizon portfolios. As we continue down our current path, we will monitor the individual companies in each of these spaces and invest in either individual stocks or thematic ETFs when we believe the market is undervaluing their exposure to AI-related drivers.
The Path Forward - Tech Cash Flow Growth Will Determine Whether Earnings Will "Boom" or "Bust"
Looking forward, one of the most important indicators we will watch to differentiate between ‘boom’ or ‘bust’ earnings cycles will be cash flow growth trends in the technology sector (as shown in chart below). We favor cash flow over earnings analysis in tech’s case, as the two concepts are closely related but cash flow is less likely to be ‘gamed’ by accounting tricks.
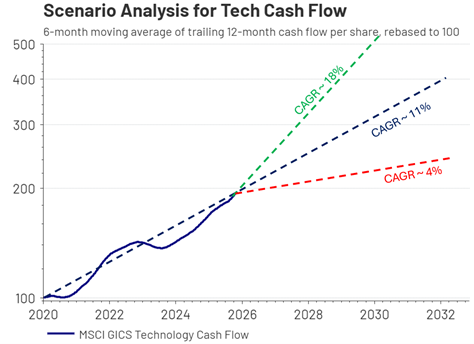
Tech cash flow growth that is generally consistent with its’ long-term trend of around 11% (blue line on Chart, right) is our Base Case last week’s Strategic View. We believe this pace of growth is more sustainable and will prolong the bull market in stocks. If we begin to see tech cash flow growth start to trend significantly lower (red dotted line), this suggests the AI infrastructure supply is ahead of demand and earnings disappointments are likely to result in a significant decline in share prices – our Bear Case. Conversely, growth rates that more closely replicate the recent 2023-25 AI-driven trend of 18% cash flow growth (green dotted line) match our Bull Case. While this level of growth is clearly good news, the risk is that it creates a true 1990s-style valuation ‘bubble’… but probably not for several years. At that point our concerns will be heightened, and we would have to assess how powerfully AI is transforming other companies and the US economy in order to remain constructive on US stocks broadly.
CONCLUSION:
‘Bubble’ Not Inevitable; Gold Rush Analog Suggests Companies’ Earnings Can Grow into Their Valuations
Many market prognosticators seem to believe that a bubble followed by a bust is the only possible outcome from here. However, as we laid out in last week’s Strategic View, we do not view this as an imminent market outcome. Using the analog of the late 1990s period, we think the S&P 500, if it is indeed headed for a bubble at all, may be only in the relatively early stages today. We will continue to evaluate earnings potential and see if we think valuations are unsustainable and a bubble is forming.
In contrast, we would like to posit a second potential outcome: a more sustained earnings trend, which is analogous to the end of the gold rush. For this scenario to play out, the benefits of AI must become widely adopted and beneficial across our economy. The premise would be that while high valuations may compress returns for AI-centered companies going forward, the medium-term returns will remain positive. Sustainable growth in earnings and cash flow will allow these companies to “grow into” their valuations over time. We currently view this scenario as the most likely.
Additionally, in this scenario, there will be another major opportunity for investors outside of traditional tech. For example, sectors such as healthcare, financials and consumer discretionary are exploring AI applications to help drive higher levels of profitability and growth that might not have otherwise been possible. This “value rotation” could create a multi-stage bull market that broadens out and allows non-tech sectors to participate more in market upside.
By Adam Grossman, CFA
Originally published by RiverFront Investment Group
For more news, information, and analysis, visit the ETF Strategist Content Hub.
Important Disclosure Information
The comments above refer generally to financial markets and not RiverFront portfolios or any related performance. Opinions expressed are current as of the date shown and are subject to change. Past performance is not indicative of future results and diversification does not ensure a profit or protect against loss. All investments carry some level of risk, including loss of principal. An investment cannot be made directly in an index.
Information or data shown or used in this material was received from sources believed to be reliable, but accuracy is not guaranteed.
This report does not provide recipients with information or advice that is sufficient on which to base an investment decision. This report does not take into account the specific investment objectives, financial situation or need of any particular client and may not be suitable for all types of investors. Recipients should consider the contents of this report as a single factor in making an investment decision. Additional fundamental and other analyses would be required to make an investment decision about any individual security identified in this report.
The comments above are subject to change and are not intended as investment recommendations. There is no representation that an investor will or is likely to achieve positive returns, avoid losses or experience returns as discussed for various market classes.
Chartered Financial Analyst is a professional designation given by the CFA Institute (formerly AIMR) that measures the competence and integrity of financial analysts. Candidates are required to pass three levels of exams covering areas such as accounting, economics, ethics, money management and security analysis. Four years of investment/financial career experience are required before one can become a CFA charterholder. Enrollees in the program must hold a bachelor’s degree.
All charts shown for illustrative purposes only. Technical analysis is based on the study of historical price movements and past trend patterns. There are no assurances that movements or trends can or will be duplicated in the future.
Stocks represent partial ownership of a corporation. If the corporation does well, its value increases, and investors share in the appreciation. However, if it goes bankrupt, or performs poorly, investors can lose their entire initial investment (i.e., the stock price can go to zero). Bonds represent a loan made by an investor to a corporation or government. As such, the investor gets a guaranteed interest rate for a specific period of time and expects to get their original investment back at the end of that time period, along with the interest earned. Investment risk is repayment of the principal (amount invested). In the event of a bankruptcy or other corporate disruption, bonds are senior to stocks. Investors should be aware of these differences prior to investing.
In general, the bond market is volatile, and fixed income securities carry interest rate risk. (As interest rates rise, bond prices usually fall, and vice versa). This effect is usually more pronounced for longer-term securities). Fixed income securities also carry inflation risk, liquidity risk, call risk and credit and default risks for both issuers and counterparties. Lower-quality fixed income securities involve greater risk of default or price changes due to potential changes in the credit quality of the issuer. Foreign investments involve greater risks than U.S. investments, and can decline significantly in response to adverse issuer, political, regulatory, market, and economic risks. Any fixed-income security sold or redeemed prior to maturity may be subject to loss.
Investing in foreign companies poses additional risks since political and economic events unique to a country or region may affect those markets and their issuers. In addition to such general international risks, the portfolio may also be exposed to currency fluctuation risks and emerging markets risks as described further below.
Changes in the value of foreign currencies compared to the U.S. dollar may affect (positively or negatively) the value of the portfolio’s investments. Such currency movements may occur separately from, and/or in response to, events that do not otherwise affect the value of the security in the issuer’s home country. Also, the value of the portfolio may be influenced by currency exchange control regulations. The currencies of emerging market countries may experience significant declines against the U.S. dollar, and devaluation may occur subsequent to investments in these currencies by the portfolio.
Foreign investments, especially investments in emerging markets, can be riskier and more volatile than investments in the U.S. and are considered speculative and subject to heightened risks in addition to the general risks of investing in non-U.S. securities. Also, inflation and rapid fluctuations in inflation rates have had, and may continue to have, negative effects on the economies and securities markets of certain emerging market countries.
Technology and internet-related stocks, especially of smaller, less-seasoned companies, tend to be more volatile than the overall market.
Artificial intelligence, or AI, refers to the simulation of human intelligence by software-coded heuristics. Nowadays this code is prevalent in everything from cloudbased, enterprise applications to consumer apps and even embedded firmware.
Artificial general intelligence (AGI) is a hypothetical stage in the development of machine learning in which an artificial intelligence (AI) system can match or exceed the cognitive abilities of human beings across any task. It represents the fundamental, abstract goal of AI: the artificial replication of human intelligence in a machine or software.
Index Definitions:
Standard & Poor’s (S&P) 500 Index measures the performance of 500 large cap stocks, which together represent about 80% of the total US equities market.
The MSCI Global Industry Classification Standard (GICS) is a framework developed by MSCI and S&P Dow Jones Indices to classify companies into various sectors, industries, and sub-industries. The GICS structure consists of 11 sectors, 25 industry groups, 74 industries, and 163 sub-industries, allowing for detailed classification of companies based on their principal business activities.
When referring to being “overweight” or “underweight” relative to a market or asset class, RiverFront is referring to our current portfolios’ weightings compared to the composite benchmarks for each portfolio.
RiverFront Investment Group, LLC (“RiverFront”), is a registered investment adviser with the Securities and Exchange Commission. Registration as an investment adviser does not imply any level of skill or expertise. Any discussion of specific securities is provided for informational purposes only and should not be deemed as investment advice or a recommendation to buy or sell any individual security mentioned. RiverFront is affiliated with Robert W. Baird & Co. Incorporated (“Baird”), member FINRA/SIPC, from its minority ownership interest in RiverFront. RiverFront is owned primarily by its employees through RiverFront Investment Holding Group, LLC, the holding company for RiverFront. Baird Financial Corporation (BFC) is a minority owner of RiverFront Investment Holding Group, LLC and therefore an indirect owner of RiverFront. BFC is the parent company of Robert W. Baird & Co. Incorporated, a registered broker/dealer and investment adviser.
To review other risks and more information about RiverFront, please visit the website at riverfrontig.com and the Form ADV, Part 2A and/or Form CRS. Copyright ©2025 RiverFront Investment Group. All Rights Reserved. [ID 4997164]

