

What’s driving the precious metal higher and higher?
Gold has been shining brightly — and capturing the attention of many investors.
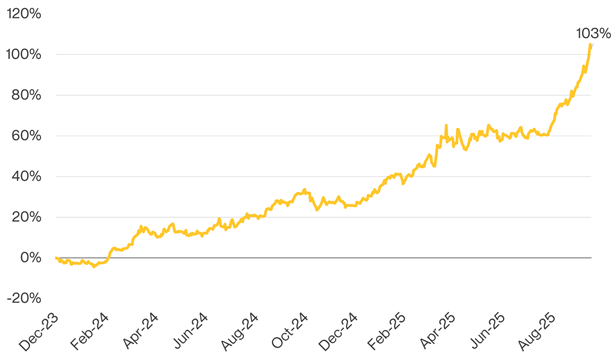
Since the end of 2023, gold* is up 103% (see the chart). That compares to a 43% return for the S&P 500 and an 8.6% return for U.S. investment grade bonds**.
Economic and political uncertainty is driving investors and central banks to boost gold holdings, fueling the metal’s surge. In the U.S., the fear that inflation, tariffs, the national debt, and other factors could hurt the dollar and the economy has some investors buying gold and other non-traditional assets (such as crypto) that they expect will hold up well if stocks and bonds falter.
LBMA Gold Price Index
In fact, gold has historically offered low day-to-day correlations with stocks and bonds – although it also has its own risk factors. Some important facts to keep in mind:
- Gold is its own asset class: Gold generates no earnings or cash flows, unlike stocks, and has no default risks, unlike bonds. Its price is mainly influenced by changes in real yields, the dollar, and investor sentiment.
- Gold often zigs when stocks zag: Gold is one of the few major asset classes that has consistently exhibited a very low correlation with stocks. That means when stocks fall, the value of gold often tends to rise. This low correlation often works in reverse as well. For example, gold plummeted by roughly 45% from September 2011 through December 2015—a period during which stocks gained more than 92%.
- Gold itself isn’t as stable or steady as some investors may assume: Despite being a “safe haven” asset, the average daily volatility of gold since 2005 is around 17%—nearly as volatile as stocks (19%) during that period. Bonds, in contrast, experienced average daily volatility of just 4%.
Ultimately, gold has the potential to serve as a valuable portfolio diversification tool, but it lacks some of the characteristics that can help stocks generate long-term capital growth. Additionally, while gold and crypto are often viewed similarly as diversifiers, the two assets actually differ in meaningful ways (a topic we’ll explore in a future Big Number).
It’s also worth noting that gold’s run-up since the end of 2023 has occurred despite real, inflation-adjusted bond yields being materially positive (with the 10-year U.S. Treasury real yield currently at 1.75%, for example). Positive real yields on bonds typically make gold less attractive to investors, as gold offers no yield. We will continue to watch this dynamic to see how it evolves.
By Mike Dickson, Ph. D.
Originally published October 22, 2025
For more news, information, and analysis, visit the ETF Strategist Content Hub.
*LBMA Gold Price Index
**Bloomberg US Aggregate Bond Index
The LBMA Gold Price benchmarks are the global benchmark prices for unallocated gold and silver delivered in London. The Bloomberg U.S. Aggregate Bond Index is a broadbased benchmark that
measures the investment grade, U.S. dollar-denominated, fixed-rate taxable bond market, including
Treasuries, government-related and corporate securities, mortgage-backed securities, asset-backed
securities and collateralized mortgage-backed securities. The S&P 500 or Standard & Poor’s 500 Index is
a market-capitalization-weighted index of the 500 largest U.S. publicly traded companies. References to indices, or other measures of relative market performance over a specified period of time are provided for informational purposes only. Reference to an index does not imply that any account will achieve returns, volatility or other results similar to that index. The composition of an index may not reflect the manner in which a portfolio is constructed in relation to expected or achieved returns, portfolio guidelines, restrictions, sectors, correlations, concentrations, volatility or tracking error targets, all of which are subject to change. It is not possible to invest directly in an index. Information obtained from third party sources is believed reliable but has not been vetted by the firm or its personnel
This commentary is written by Horizon’s asset management team. Past performance is not indicative of future results. Nothing contained herein should be construed as an offer to sell or the solicitation of an offer to buy any security. This report does not attempt to examine all the facts and circumstances that may be relevant to any company, industry, or security mentioned herein. We are not soliciting any action based on this document. It is for the general information of clients of Horizon Investments, LLC (“Horizon”). This document does not constitute a personal recommendation or take into account the particular investment objectives, financial situations, or needs of individual clients. Before acting on any analysis, advice, or recommendation in this document, clients should consider whether the security in question is suitable for their particular circumstances and, if necessary, seek professional advice. Investors may realize losses on any investments. Asset allocation cannot eliminate the risk of fluctuating prices and uncertain returns. All investing involves the risk of loss.
The investments recommended by Horizon are not guaranteed. There can be economic times when all investments are unfavorable and depreciate in value. Clients may lose money. This commentary is based on public information that we consider reliable, but we do not represent that it is accurate or complete, and it should not be relied on as such. The opinions expressed herein are our opinions as of the date of this document. These opinions may not be reflected in all of our strategies. We do not intend to and will not endeavor to update the information discussed in this document. No part of this document may be (i) copied, photocopied, or duplicated in any form by any means or (ii) redistributed without Horizon’s prior written consent. Forward-looking statements cannot be guaranteed. Other disclosure information is available at www.horizoninvestments.com.
Horizon Investments is a registered trademark of Horizon Investments, LLC
©2025 Horizon Investments, LLC.

