

Last week’s market commentary, titled “A Rising Tide and A Look at Gold,” discussed broadening market participation and the relative weakness of a few of the larger technology stocks. In this commentary, we will provide a brief update to those comments made last week. This week’s Chart of the Week is the Utilities sector.
The trend of broadening participation as well as weakening technology stocks continued last week. Research conducted by Bank of America noted that technology stocks saw their largest weakly outflow ever last week, while equities as a whole saw net weekly inflows.
According to Canterbury’s risk-adjusted sector rankings, the Information Technology and Communication sectors rank 5th and 6th (out of 11 sectors). At the start of February, Communications and Information Technology ranked 1st and 3rd respectively. Consumer Discretionary, which has heavy exposure to Amazon and Tesla, ranks 9th.
While many technology stocks remain strong, some of the tech-related sector weakness comes from the Magnificent 7 stocks. Here is a quote from last week’s update:
“At least three of the Magnificent 7 stocks are beginning to slip and show weakening relative strength to the broader market indexes. This is something to keep an eye on, given the heavy impact that technology stocks have on the market’s movements.”
The table below shows which Mag 7 stocks are included in each of the Information Technology, Communications, and Consumer Discretionary sectors.

While markets are rising in 2024, three of the Magnificent 7 stocks (one from each of the three sectors above) reached new year-to-date lows last week, and each are down more than -10% from their most recent peak. Those three stocks are Apple, Google, and Tesla. As it stands right now, Apple and Google are experiencing normal corrections (about -10%), but Tesla’s overall decline is now -40% since its July 2023 peak.
Chart of the Week- Utilities
Last week, we featured GLDM as our chart of the week. GLDM is the Gold ETF. We pointed out a few positive technical characteristics. The Gold ETF proceeded to go up +4.55%. Sometimes, good technicals and a little bit of good luck combine for a good week.
This week, we will discuss the Utilities sector ETF, XLU. Refer to the chart and corresponding, numbered points below.
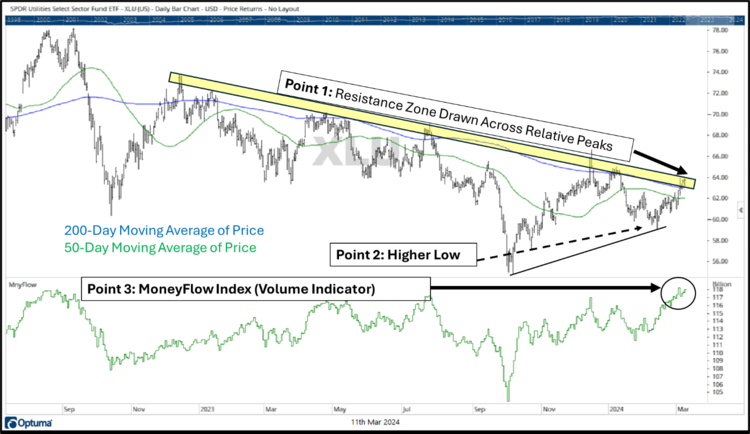
- Point 1 shows a descending “resistance” zone. This is a zone where supply and demand shift. When price has reached this zone, supply takes over and causes a sell-off. Right now, price is intersecting this overhead resistance zone.
- Point 2 establishes that the Utilities sector ETF recently set a higher low point. An uptrend often has a pattern of higher highs and higher lows. Prior to point 2, the sector was following a pattern of lower lows and lower highs. In other words, Utilities is attempting to establish a new trend.
- Point 3 shows the MoneyFlow Index, which is a “smart” money indicator. Ideally, you want to see uptrends have higher volume. The MoneyFlow Index established a new high on the latest move, indicating that volume has been strong.
Currently, the Utilities sector ETF is at a zone of resistance. The sector has gone lower in previous instances after hitting resistance. However, Utilities recently set a higher low and has had stronger volume on the latest up move. While the sector is not yet a “buy,” this is positive.
The next FOMC meeting is scheduled for later this month. Many investors previously speculated that the Fed may look to lower interest rates at this meeting. Now, the Fed is expected to hold rates steady. While predicting the future is difficult, the Utilities sector can be interest rate sensitive. One way or the other, the Fed’s upcoming interest rate decision could have an impact on the sector’s movement.
Bottom Line
While some large technology stocks have shown signs of weakening, market participation is broadening. It is interesting that tech stocks saw a historically large number of outflows last week, but it is not yet a concern for many technology-related stocks. We continue to monitor technology stocks for rising volatility and signs of new trends.
Our adaptive portfolio, the Canterbury Portfolio Thermostat continues to make some minor adjustments. The portfolio took a position in Gold prior to its rise last week. We also have exposure to several different stocks/ETFs that represent several market segments, ranging from Energy to Staples to Technology and Industrials to name a few examples.
For more news, information, and analysis, visit the ETF Strategist Channel.

