

At long last, 2024’s most anticipated event has finally happened. Come January 20th, Donald Trump will be inaugurated, becoming just the second President to serve non-consecutive terms (Grover Cleveland was the first).
The election results, including Republican gains in the Senate and potential House majority, triggered a positive market response. The S&P 500 rose +2.5% on Wednesday following the election. This one-day move was enough to be qualified as an “outlier” day, defined as a trading day beyond +/-1.50%. Last Monday, our market commentary stated that there was a high probability of an outlier day, regardless of the election’s outcome, given that volatility was low, markets had just seen an outlier a few days prior, and the significant news event (election).
The Outlier Occurred to the Upside
While the direction of an outlier day is unpredictable, we now know that the outlier occurred to the upside.
The market’s movement last week told us that investors are optimistic about another Trump presidency. As stated on his campaign site, Donald Trump promises to improve the economy, renew global leadership, and “unleash energy dominance.” As a result of his election, the Consumer Discretionary sector established its first new high since 2021, Aerospace & Defense stocks climbed to new heights, and the Energy sector is attempting to begin a new uptrend.
Energy Sector — A New Uptrend?
While an upward movement in energy stocks could be attributed to the election results, the energy sector has been getting into position to potentially move upward for a few months. See the chart of XLE (S&P500 Energy ETF) and points below.
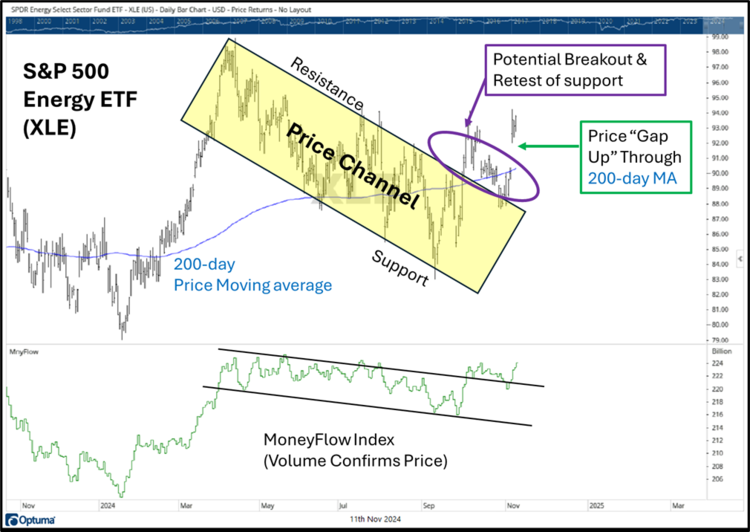
- Channel Breakout & Retest — From March through September, XLE was in a descending channel, with marked overhead resistance and underneath support. Finally, the sector broke out, and then receded to test prior resistance for new support.
- Price Gap through a Moving Average — As XLE was testing new support, the election results created a “gap up” in price. This gap occurred at the 200-day moving average of price. The 200-day moving average is often considered a point where supply & demand shift, making the gap up more significant.
- Volume confirms price — XLE’s volume indicators have looked rather positive even during the sector’s decline. The recent upward move established a new high in MoneyFlow, or “smart money,” confirming the move. Ideally, securities go up on heavy volume and decline on low volume.
A Note on Tesla and the Counterintuitive Nature of Markets
As described above, the Consumer Discretionary sector recently set a new high. The two largest securities in the sector are Amazon and Tesla. Since the election, Tesla has been one of the best performing stocks. Why would Tesla be reacting so positively?
Elon Musk may have been a big Trump supporter, but Trump has proposed the idea of rolling back electric vehicle mandates and subsidies. Shouldn’t that be bad for a company like Tesla and its stock? Remember, stocks are driven by supply & demand. Supply and demand are counterintuitive in that most of the time, securities will do what the herd would least expect.
If you’re looking for a fundamental, company-related reason for the stock’s surge, my best answer is that Tesla is one of the few (perhaps only) profitable electric car manufacturers, and a rollback of government subsidy weakens their competition.
International Stocks Weaken
While US stocks rose on Wednesday, the international markets did not seem to like the election results. The EAFE (Europe, Australia, Far East) declined -1.4% on Wednesday, and the Emerging Markets index was down -1.2%. Each of these indexes rallied on Thursday, erasing Wednesday’s losses, before declining again on Friday. The EAFE was down -1.4% again on Friday, while Emerging Markets declined -2.5%.
What Happens Next?
Now that the results are in and markets have reacted, the big question is now “what happens next?” There is no doubt that a Trump election brought positivity and optimism to the financial markets. Virtually every equity asset class (and crypto currency) seemed to rise. While investors are optimistic, you should always proceed with caution.
Number one, Donald Trump has promised a lot that appeased most American voters. It’s now up to his administration to deliver. Whether you have confidence or not, markets will be sure to react, and likely react before news becomes reality.
Number two, anticipated news is already out. This election season, as we got closer to November, markets correlated positively with Donald Trump’s election betting odds. Now that the expectation has become reality, will markets continue to climb? As Gordon Gecko said in the movie Wall Street, “the most valuable commodity I know of is information.” Now that the cat is out of the bag, what information will come next?
Bottom Line
Number 3, and above all else, this is the reality of the markets right now. Volatility remains low and market conditions are favorable today. That could all change next year, or next month, or next week, but nothing has happened yet. Investors should always proceed with caution but have a process and strategy for navigating all market environments-bull or bear.
Canterbury employs a sophisticated portfolio management strategy, called Adaptive Portfolio Management. Right now, Canterbury’s Adaptive Portfolio Management strategy holds mostly equities such as sector funds and individual stock securities. We also hold a gold ETF and have no exposure to bonds. Bonds are currently in a bear market. While the most used portfolio management strategies will allocate a percentage to bonds, primarily for risk management purposes, Canterbury will use inverse positions to maintain low volatility. Inverse positions move in the opposite direction of their underlying indexes. In this case, those inverse positions are inverse EAFE and inverse Emerging Markets. Those indexes were mentioned in this update as being some of the weakest equity classes (making their inverse positions relatively stronger).
The long-held practice of holding a fixed percentage asset allocation of stocks and bonds (like a 60/40 portfolio) is not the best way to manage the risk of dynamic markets. Canterbury has spent over 20 years developing our adaptive portfolio management process that has been built on using objective scientific principles and can provide evidence-based results.
For more news, information, and analysis, visit the ETF Strategist Channel.

