

Lately, headlines have been buzzing about the government shutdown and its potential impact on the economy and financial markets. Previous government shutdowns have had negligible effects on the broader economy and financial markets though delays in economic data releases (e.g., employment and inflation figures) occasionally heightened short-term volatility and uncertainty. This lack of significant impact makes sense because the federal government is just one of the four broad economic cohorts: households, businesses, state and local governments, and the federal government. Notably, the federal government is actually the smallest contributor in percentage of GDP terms. Far larger and more impactful are the household and business sectors, and these areas remain in good shape overall.
There has also been chatter about recessionary risks, especially in response to recent weak employment data. Weak employment reports have led to renewed debates about market valuations and where the U.S. Federal Reserve (Fed) might take interest rates next, but we caution against overreacting to single data points. As reflected in our latest Recession Tracker update, which is based on a four-factor model, broader incoming economic data continues to point to a healthy economy despite uncertainties.
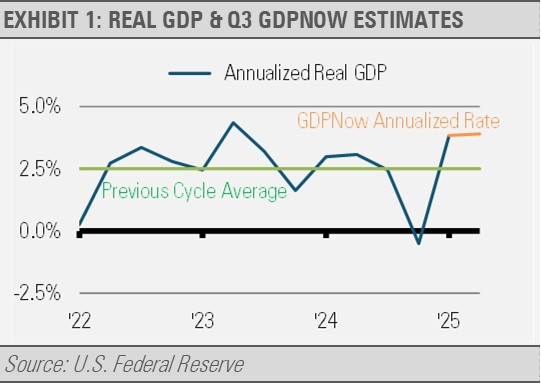
Take GDP growth, for example. The Atlanta Fed’s GDPNow model is projecting 3.8% real growth for the third quarter. That is well above the prior business cycle’s average of 2.5%. This strength comes largely from the private sector as households and businesses remain healthy overall.
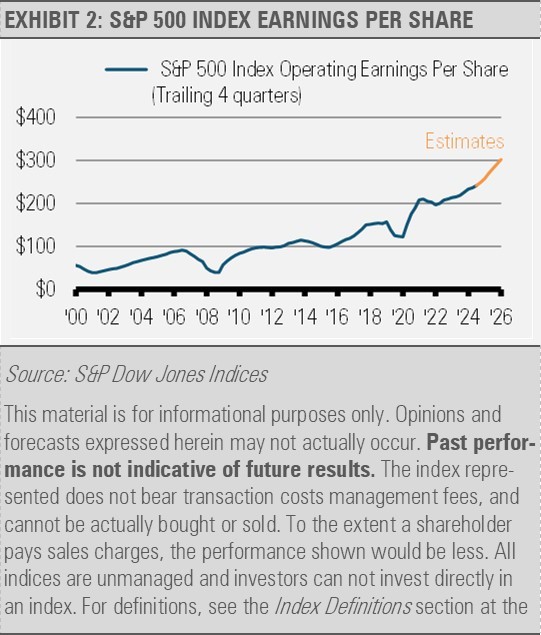
When the economy grows, corporate revenues and earnings tend to rise as well. In fact, S&P Global continues to forecast record earnings for the S&P 500 Index in the coming quarters. Growing revenues and earnings are also supportive of stock prices even with periodic volatility.
Meanwhile, tariff uncertainty is causing turbulence in some industries, but the broader U.S. economy remains relatively insulated. That is because the U.S. is a services-driven economy and less reliant on trade with other countries relative to GDP than many other economies.
Regarding the labor market, slowing jobs growth might seem concerning at first but we believe it reflects a normalization post-pandemic. Demand for new workers is cooling but not collapsing while layoffs remain at normal levels. Additionally, the growth rate of the labor force has slowed along with net immigration. Net immigration could fall to less than 250,000 per year, down from 1 million per year on average from 2000-2020, which should hold the unemployment rate close to the current historically low levels.
This balance in employment combined with stabilizing inflation gives the Fed room to cut short-term interest rates further. We expect the Fed to implement a series of 0.25% reductions to short-term interest rates, two more times this year and likely two cuts by their July meeting next year. This would bring the Fed Funds Rate closer to the Fed’s 3% estimate of neutral. After years of an excessively accommodative policy, followed by excessively restrictive policy, we would be delighted to see the Fed get back to neutral and recede into the economic background.
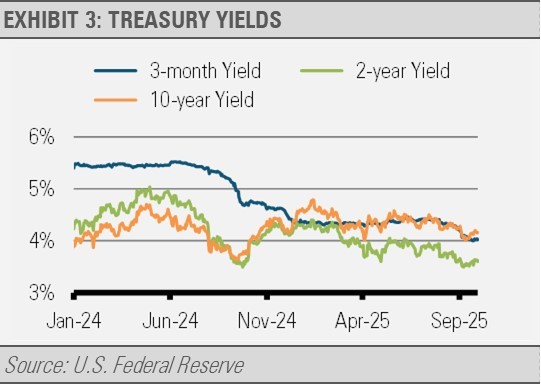
Finally, long-term yields remain anchored with the 10-year Treasury yield at approximately 4.15% versus the 2-year at 3.63%, which has resulted in a steepening 10s-2s yield curve since April. In our view, this normalization signals expectations of further short-term interest rate reductions, keeping the 2-year yield low while sustained economic growth keeps the long end of the curve well anchored.
INVESTMENT IMPLICATIONS
Given our outlook, we remain overweight U.S. equities, especially high-quality businesses with strong earnings and low leverage. We are currently favoring the information technology, financials, and industrials sectors, and we continue to see opportunities in small caps.
On the alternatives side, we are using equity option overlay strategies to enhance yield and manage downside risk depending on the Strategy. We also have allocated to a merger-arbitrage ETF that can offer consistent returns with limited volatility and low correlation to traditional equity and fixed income holdings.
Within our fixed income allocation, we are cautious about short-duration assets due to the reinvestment risk. So, we have shifted to the belly of the yield curve by focusing on intermediate-term asset-backed securities. We are still underweight U.S. Treasuries and using ETFs to help diversify across credit qualities and durations while maintaining flexibility.
Overall, we believe the U.S. is on the cusp of a new era of economic growth driven by a resilient private sector and strong fundamentals in both businesses and households. We are optimistic not because of short-term noise, but because of the solid foundation beneath the data.
THE CASH INDICATOR
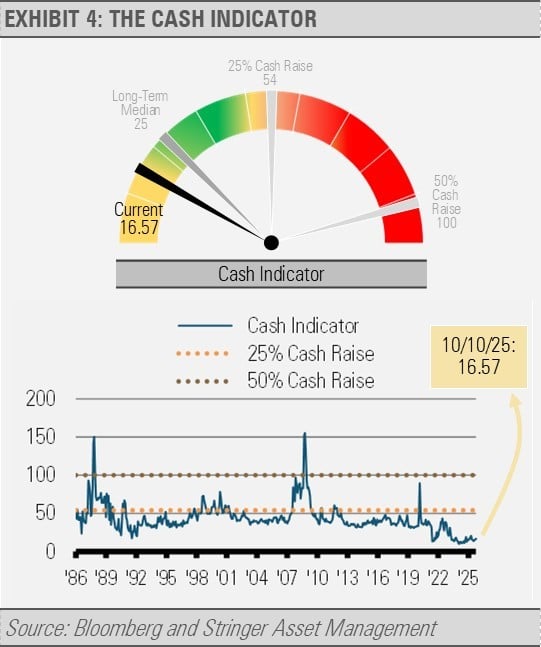
The Cash Indicator (CI) has once again proven useful in helping us navigate market volatility. After bouncing off exceptionally low levels from last year and then jumping with April’s tariff-related uncertainty, the CI has been range bound below its historical norms. These low levels suggest that markets are somewhat complacent and not pricing in much risk, which leaves them more susceptible to shocks than normal. Still, with the positive economic backdrop, we view bouts of volatility as opportunities to increase allocations to high quality businesses.
For more news, information, and analysis, visit the ETF Strategist Content Hub.
DISCLOSURES
Any forecasts, figures, opinions or investment techniques and strategies explained are Stringer Asset Management, LLC’s as of the date of publication. They are considered to be accurate at the time of writing, but no warranty of accuracy is given and no liability in respect to error or omission is accepted. They are subject to change without reference or notification. The views contained herein are not to be taken as advice or a recommendation to buy or sell any investment and the material should not be relied upon as containing sufficient information to support an investment decision. It should be noted that the value of investments and the income from them may fluctuate in accordance with market conditions and taxation agreements and investors may not get back the full amount invested.
Past performance and yield may not be a reliable guide to future performance. Current performance may be higher or lower than the performance quoted.
The securities identified and described may not represent all of the securities purchased, sold or recommended for client accounts. The reader should not assume that an investment in the securities identified was or will be profitable.
Data is provided by various sources and prepared by Stringer Asset Management, LLC and has not been verified or audited by an independent accountant.
Index Definitions:
S&P 500 Index – This Index is a capitalization-weighted index of 500 stocks. The Index is designed to measure performance of a broad domestic economy through changes in the aggregate market value of 500 stocks representing all major industries.

