ETFdb Logo
  • ETF Database
  • Content Hubs
    • Themes
      • Active ETF
      • Alternatives
      • Artificial Intelligence
      • China Insights
      • Core Strategies
      • Crypto
      • Disruptive Technology
      • Energy Infrastructure
      • ETF Building Blocks
      • ETF Investing
      • ETF Strategist
      • Financial Literacy
      • Fixed Income
      • Free Cash Flow
      • Future ETFs
      • Innovative ETFs
      • Institutional Income Strategies
      • Leveraged & Inverse
      • Market Insights
      • Market Outlooks
      • Modern Alpha
      • Nuclear Energy
      • Portfolio Strategies
      • Sector Investing
      • Tax Efficient Income
      • Thematic Investing
    • Asset Class
      • Equity
        • U.S. Equity
        • Int'l Developed
        • Emerging Market Equities
      • Alternatives
        • Gold/Silver/Critical Materials
        • Cryptocurrency
        • Currency
        • Volatility
      • Fixed Income
        • Investment Grade Corporates
        • US Treasuries & TIPS
        • High Yield Corporates
        • Int'l Fixed Income
    • ETF Ecosystem
    • ETFs in Canada
    • Market Outlook
    • Crypto ETF Hub
  • Tools
    • ETF Screener
    • ETF Country Exposure Tool
    • ETF Database Categories
    • Indexes
    • Scenario Analysis
    • Watchlists
    • Head-To-Head ETF Comparison Tool
    • Mutual Fund To ETF Converter
    • ETF Stock Exposure Tool
    • ETF Issuer Fund Flows
  • Research
    • ETF Education
    • Equity Investing
    • Dividend ETFs
    • Leveraged ETFs
    • Inverse ETFs
    • Index Education
    • Index Insights
    • Top ETF Sectors
    • Top ETF Issuers
    • Top ETF Industries
  • Webcasts
  • Sectors
    • Sector Investing Content Hub
    • XLK
    • XLI
    • XLU
    • XLY
    • XLP
    • XLRE
    • Sector Power Rankings
    • XLE
    • XLC
    • XLF
    • XLV
    • XLB
  • Multimedia
    • ETF 360 Video Series
    • ETF of the Week Podcast
    • Gaining Perspective Podcast
    • ETF Prime Podcast
    • Video
  • Company
    • About VettaFi
    • Get VettaFi’ed
  • PRO
    • Pro Content
    • Pro Tools
    • Advanced
    • FAQ
    • Free sign up
    • Login
  1. ETF Strategist Content Hub
  2. The Lion, the Witch, and the Wardrobe
ETF Strategist Content Hub
Share

The Lion, the Witch, and the Wardrobe

Apr 26, 2023
2023-04-26

The Ned Davis Research Catastrophic Stop Loss Model, part of our Smart Sector Global Balance Portfolio Strategy, remains, since November 2022, fully invested versus its S&P 500 benchmark. If our indicators reverse and suggest otherwise, we will follow. Also, while upside participation has improved, there is still a lot of work ahead (Figure 2)! Until this is resolved, the “Winter of Discontent” continues.

Winter on Wall Street

In C. S. Lewis’s book, The Lion, the Witch, and the Wardrobe, his famous Chronicles of Narnia, the evil White Witch imposes an eternal winter on Narnia. This period symbolized a dead, stagnant time. Nothing grows, and animals hibernate. The Witch’s winter destroys the beauty and the life in Narnia. Nearly every human has a visceral negative reaction to winter. And so, it has been on Wall Street.

One can make a case, by looking at the weekly chart of the S&P 500 as an example, that a dead and stagnant time has existed over the past 14+ months—February 2022 to the present. One could also make a case that, despite many big swings up and down, the SPX is at the same level as it was mid-April 2021—24 months. Figure 1.

Figure 1: S&P 500 weekly w/ rising 40-week MA. | “Grind it Out – Down & Difficult – Wear ’em Out.”

Figure 1: S&P 500 weekly w/ rising 40-week MA

Content continues below advertisement

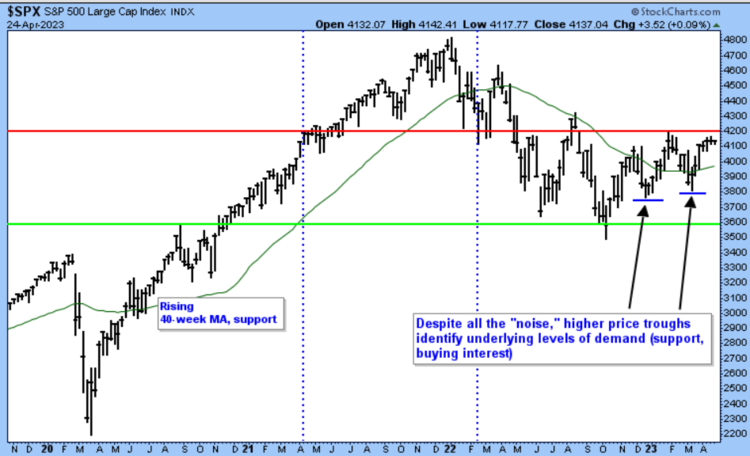
Figure 2: S&P 500 and % components above 200-day MA and 50-day MA. | Please compare the price action in the top frame with that in the middle and lower frame and the verbiage—middle frame.

Figure 2: S&P 500 and % components

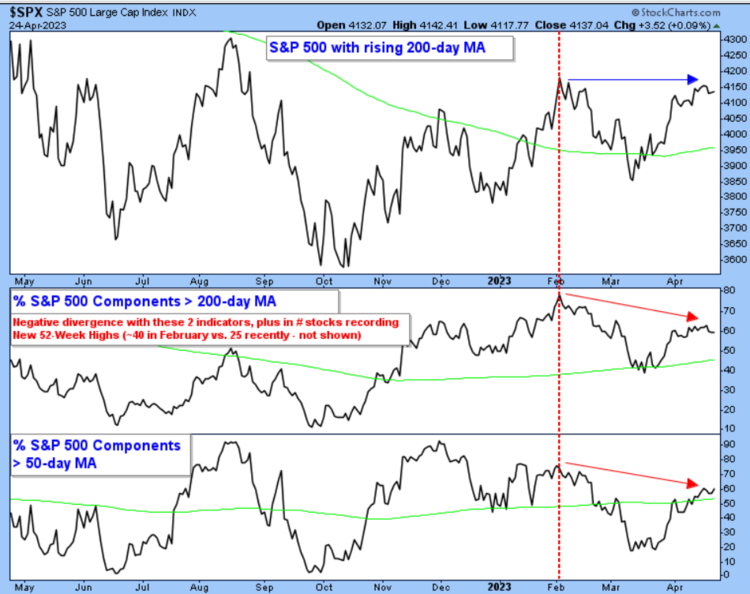
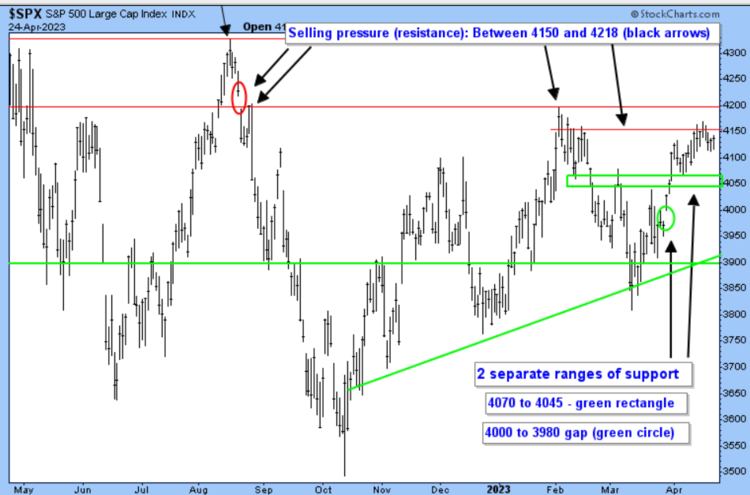
Figure 3: S&P 500 (4137.04) 1-year daily. | Working through earnings reports, how the market reacts will be more telling than the news itself. Currently, we are up near the lower end of a range of selling pressure. As discussed last week, don’t be surprised to see some hesitation/pullback now.

Figure 3: S&P 500 (4137.04) 1-year daily

The Day Hagan/Ned Davis Research Smart Sector strategies utilize measures of price, valuation, economic trends, monetary liquidity, and market sentiment to make objective, unemotional, rational decisions about how much capital to place at risk, as well as where to place that capital. Please reach out for specifics.

Day Hagan Asset Management appreciates being part of your business, either through our research efforts or investment strategies. Please let us know how we can further support you.

Art Huprich, CMT®
Chief Market Technician
Day Hagan Asset Management

—Written 4.24.2023. Chart and table source: Stockcharts.com unless otherwise noted.

Upcoming Events

Day Hagan/Ned Davis Research Smart Sector® with Catastrophic Stop, hosted by Art Day, on April 26, 2023, at 1:15 p.m. EDT

Day Hagan/Ned Davis Research Smart Sector® with Catastrophic Stop, hosted by Art Day, on April 26, 2023, at 4:15 p.m. EDT

Day Hagan Technical Analysis, hosted by Art Huprich, CMT, on May 23, 2023, at 4:15 p.m. EDT

For more news, information, and analysis, visit the ETF Strategist Channel.

Loading Articles...

Advertisement

Is Your Portfolio Positioned With Enough Global Exposure?

ETF Education Channel

How to Allocate Commodities in Portfolios

Tom LydonApr 26, 2022
2022-04-26

A long-running debate in asset allocation circles is how much of a portfolio an investor should...

Core Strategies Channel

Why ETFs Experience Limit Up/Down Protections

Karrie GordonMay 13, 2022
2022-05-13

In a digital age where information moves in milliseconds and millions of participants can transact...

}
X