

Our Cash Indicator methodology acts as a plan in case of an emergency. This is analogous to the multiple safety systems in a modern automobile, which includes an airbag. Importantly, each of these systems work together to potentially help smooth the ride.
We manage risk within our strategic, long-term allocations based on diversification across equity, fixed income, and alternative assets and a focus on more attractive relative values.
We manage risk tactically over the short-term by investing across a broad array of themes and asset classes including cash. We can either invest opportunistically or defensively depending on the environment.
Cash Indicator
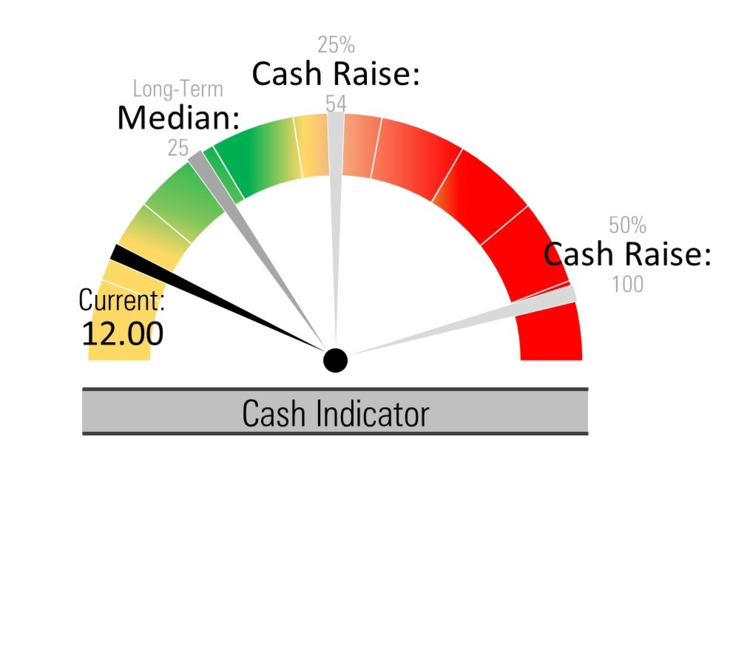
Our proprietary Cash Indicator (CI) provides insight into the health of the market by monitoring the level of fear using equity and fixed income indicators. This warning system is designed to signal us to either a 25% or 50% cash position to potentially protect principle and provide liquidity to reinvest at lower and more attractive valuations.
The CI has dipped back down to the low end of its historical range. Readings this low suggest overly complacent financial markets. We expect market volatility to increase to more normal levels in the coming months.
Strategic View
Equity Valuations: The recent market rally has pushed valuations broadly higher and extremely high for the narrow group of equities that led last year’s rally. On a risk-reward basis, other areas of the global equity market look quite attractive with the exception of Europe and especially China.
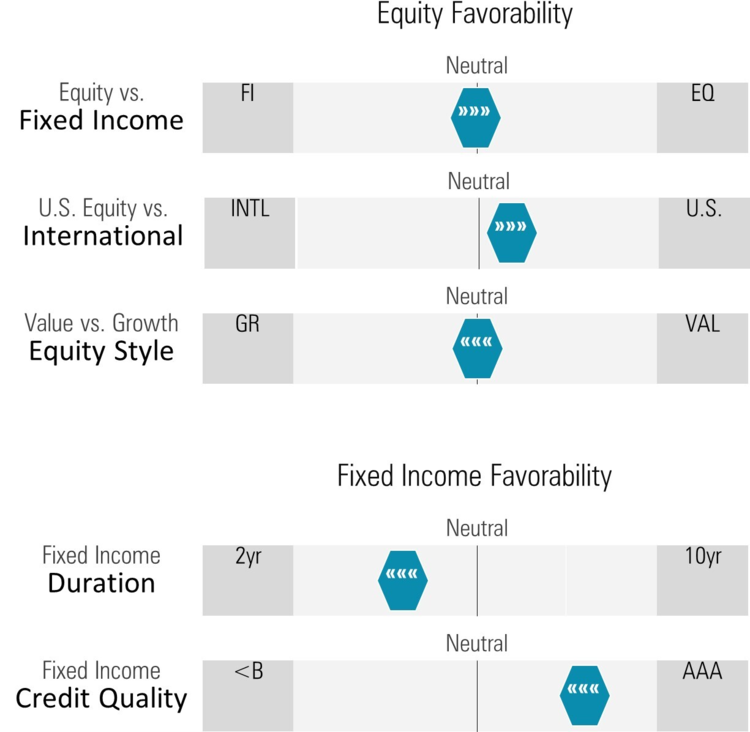
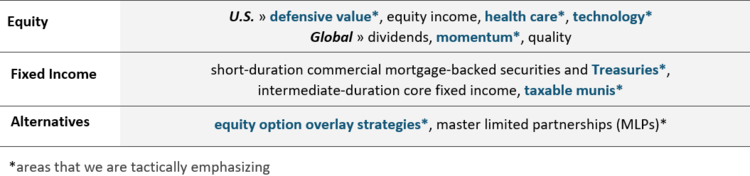
Equity Favorability: Overall, our Strategies are currently most overweight to the U.S. and Japan while being underweight emerging markets. Dividend payers and midcaps appear to represent very attractive long-term value.
Fixed Income Valuations: At current interest rates, high quality fixed income looks very attractive, while high yield is less attractive on a risk-reward basis.
Fixed Income Favorability: We have emphasized intermediate-duration holdings to lock in higher interest rates. If short-term interest rates fall in the coming months as we expect, the income generated by intermediate holdings will remain stable even as these bond prices appreciate. In addition, the commercial mortgage back space offers compelling yields outside of office space and retail.
Tactical View
Preliminary data suggests that U.S. economic growth has continued its solid run from the second half of 2023 into 2024. Persistent economic growth, falling inflation, and continued innovation have provided tailwinds to U.S. corporate earnings momentum. We expect that these trends will lead to a broadening of corporate earnings growth beyond just the technology-related industries that supplied most of the S&P 500 Index’s earnings growth last year. To benefit from these trends, we recently increased our allocation to a U.S. momentum equity ETF as well as a core large cap U.S. equity ETF that seeks to enhance returns through an equity options overlay process depending on the Strategy. To balance the Strategies’ risk profiles, we also increased our positions in short-term Treasury ETFs.
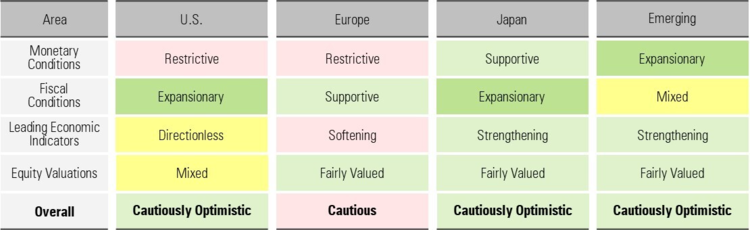
Global Broad Outlook
DISCLOSURES
Any forecasts, figures, opinions or investment techniques and strategies explained are Stringer Asset Management, LLC’s as of the date of publication. They are considered to be accurate at the time of writing, but no warranty of accuracy is given and no liability in respect to error or omission is accepted. They are subject to change without reference or notification. The views contained herein are not be taken as an advice or a recommendation to buy or sell any investment and the material should not be relied upon as containing sufficient information to support an investment decision. It should be noted that the value of investments and the income from them may fluctuate in accordance with market conditions and taxation agreements and investors may not get back the full amount invested.
Past performance and yield may not be a reliable guide to future performance. Current performance may be higher or lower than the performance quoted.
Data is provided by various sources and prepared by Stringer Asset Management, LLC and has not been verified or audited by an independent accountant.
For more news, information, and analysis, visit the ETF Strategist Channel.

