

The Magnificent Seven? Last week felt more like the Magnificent Three. Markets saw Apple stock rise 8%, Nvidia stock was up 9%, and Microsoft was up 4%. These large market components pulled the S&P 500 up 1.5% last week. Meanwhile the Equal Weight S&P 500 index, which represents the average S&P 500 stock, fell -0.50%.
Market Breadth
Since the end of May, we have seen a “negative divergence” in market breadth. In other words, while the S&P 500 has gone up in the month of June, most stocks have actually declined. It is apparent that over the last few weeks, markets have been led by the largest components and sectors.
The Information Technology Sector accounts for 30% of the S&P 500’s capitalization. The market was up 1.5% last week, but nine of the eleven sectors finished down. Information Technology was up more than 5%.
The largest stocks, or market generals, are out leading the troops on the front lines.
Negative divergences in market breadth occur from time to time. The recent divergence has only been happening for two weeks. So, while this divergence could easily be resolved, it would not be ideal to see this continue for the next few months. Negative divergences in market breadth over extended periods can lead to significant declines.
Small Cap Stocks
When the term “market” is used, most people tend to think about the S&P 500. The S&P 500 only represents the 500 largest capitalized US companies. To examine the health of smaller capitalized stocks, we can look at the Russell 2000.
The Russell 2000 continues to place new lows in relative strength, meaning that relative to the S&P 500, the index is generally underperforming. This is true whether markets are going up or going down. Year-to-Date, the Russell 2000 is flat-to-down, and is still down -18% from its 2021 peak.
While large cap stocks have mostly seen a rising tide, that rising tide isn’t lifting all ships. Small cap stocks have been weak, and we have even seen inverse small caps rise on our risk-adjusted ETF rankings.
Chart of the Week- EXR
The Real Estate sector has been one of the weakest market sectors over the past two years. Since the sector’s peak in 2021, the sector is down about -25%. As an aside, Real Estate is a very small S&P 500 sector, accounting for a little more than 2% of the S&P 500’s capitalization. In other words, a sector composed of 30 stocks is smaller than each of the five largest S&P 500 stocks are individually. Microsoft alone is 3x the size of the Real Estate Sector.
Even though Real Estate has been weak, some of the sector’s smaller components are showing early signs of turning things around. This commentary’s chart of the week is EXR, which is the stocks symbol for Extra Space Storage. See corresponding chart points below.
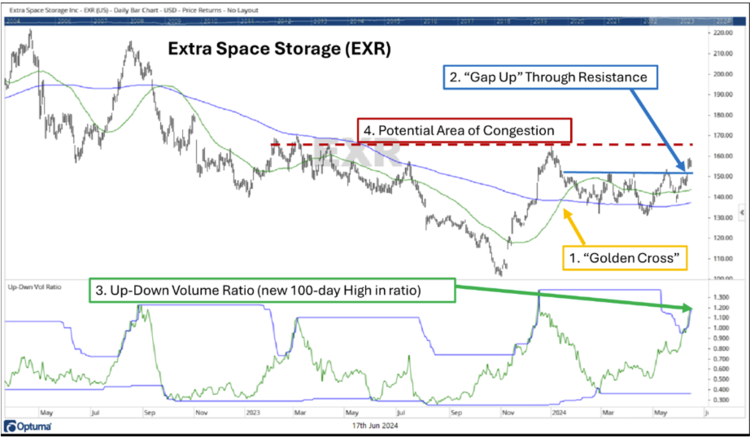
- Moving averages of price paint a picture of trends. You can see in the chart that over the last two years, the 50-day moving average (green line) has been below the 200-day moving average (blue line). Earlier this year, the 50-day MA crossed above the 200-day MA, which is what is known as a “golden cross,” and could indicate a change in long-term trend, from down to up.
- Since breaking above its 200-day moving average, EXR has experienced sideways movement and has had some overhead resistance at around the $150 price level. One positive development is last week EXR “gapped up” through this short-term resistance level. In other words, as the stock approached resistance, there was buying pressure that resulted in a jump in the price level. Ideally, the old resistance will now become support.
- Volume should confirm price. Even though EXR had moved sideways since breaking above its 200-day moving average, the upside volume had been strong. When EXR broke above short-term resistance, it did so on a new 100-day high in the Up-Down volume ratio, which compares the volume of the last 50 up days to the volume of the last 50 down days.
- Even though EXR has broken some short-term resistance, it still has some congestion to work through, particularly at price levels where recent peaks have occurred. At the red dashed line, you can see that there are four prior peaks in the last year and a half that have occurred around $164-170. The stock might encounter some difficulty in this price area.
Bottom Line
Since the beginning of this month, markets have been led by large technology stocks. There has been a negative divergence between the S&P 500 and it’s market breadth, meaning that while the market is going up, most stocks have been declining. Sometimes this will resolve itself and breadth will catch back up. We do not want to see an extended period of poor market breadth.
Small cap stocks have shown continued weakness, reaching new lows in relative strength. Normally, a healthier market will see small cap stocks doing well. That has not been the case. While large cap stocks are up about +10% this year, small caps are flat.
Real Estate continues to be among the weakest market segments, however some smaller capitalized real estate stocks are attempting to turn the corner.
The real bottom line here is that recent market movements can be attributed to a very small number of large securities. A stock like Nvidia is up substantially, and Apple has surged recently after struggling most of this year. If these stocks continue to perform well, market indexes will do well. If they begin to struggle, and smaller stocks don’t pick up the slack, then expect to see a shaky market. That has not happened yet, but it is a growing concern.
’_For more news, information, and analysis, visit the ETF Strategist Channel._

