

One of the hottest trends today revolves around ETFs that pay out a high dividend. This is often framed as Income, Yield, Dividends, or, more recently, terms like Premium, Buy Write and Option-Based Income.
Regardless of terminology, launching high income ETFs using derivatives has become the trend to follow.
According to FastTrack.com, 35 ETFs in the derivative income category have been launched this year alone, with combined assets under management exceeding $100 billion.
With such popularity and appeal, what could go wrong?
Yield ≠ Return
Before examining the performance of these ETFs, it’s important to recognize that, like it or not, everything is compared to the S&P 500. Investors seek outperformance through total return or on a risk-adjusted basis, and if not, questions will be asked.
For the ETFs in question, the pushback to underperformance might be, “But wait, there is income!”
While income alone isn’t problematic, the investor’s total return and path to that return are most important.
The table below starts with the SPDR S&P 500 ETF (SPY) along with the top 10 ETFs (by AUM) in the derivative income category with a track record longer than 10 years. The 10-year compound annual return (CAR) is for the period ending 9/30/2024.
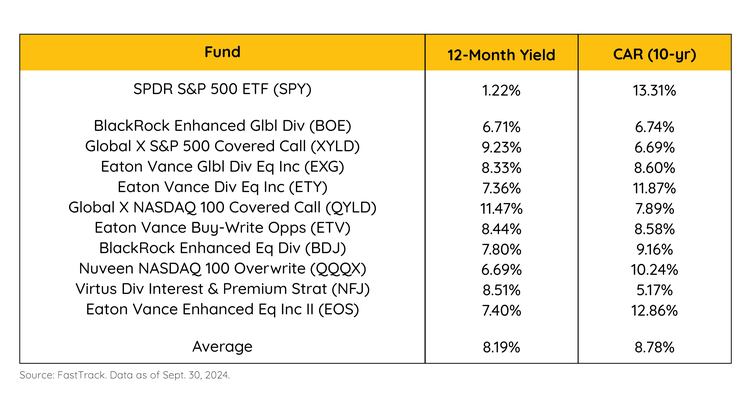
Great news – the average 12-month yield on the derivative income ETFs is 571.64% higher than for the S&P 500.
But what about the returns?
During the period, the CAR for the ETFs was, on average, 34.03% lower than the S&P 500. This shows that the total return of the income funds is substantially lower than the overall market…
That must be justified by lower risk, right?
Assessing the Risk
At Potomac, we measure risk by the historical loss of capital at any given time, specifically the maximum drawdown (MDD).
We argue that investments emphasizing high income may conceal underlying risks, and in terms of MDD, income ETFs have proven that point to be true.
The table below shows the same data with the MDD column added. Again, for the 10-year period ended 09/30/2024.
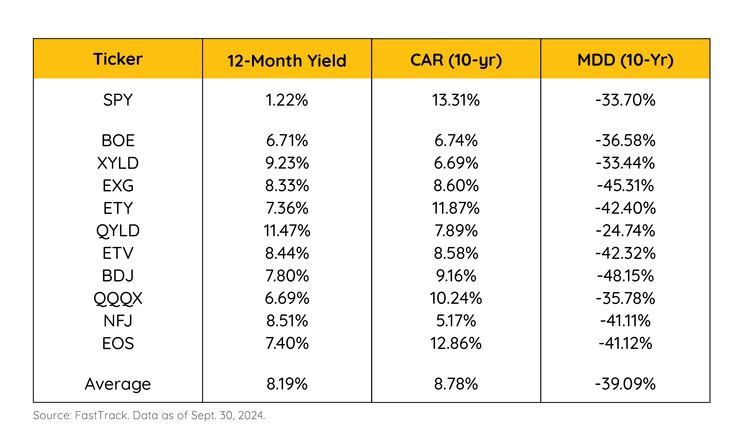
The data shows that yield alone doesn’t determine an investment’s risk. The average MDD for the income funds has been 16.01% more than the passive S&P 500 index fund.
Both data points indicate that income ETFs have been a double-edged sword, having underperformed in terms of both return and risk. Ouch!
A Note on Correlation
To address a potential counterpoint, it’s important to consider these funds’ correlation to SPY. If the correlation is low, one could argue that SPY isn’t the right benchmark, leaving our analysis invalid.
As the table below shows, for the 10-year period ended 9/30/2024, the 10 funds have an average correlation to SPY of 0.90.
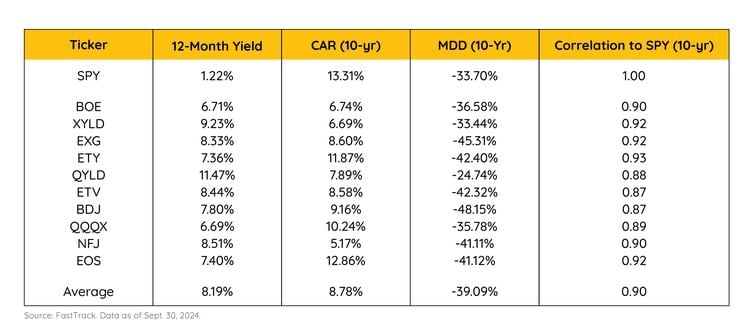
So far, we have less return, more risk, and they move in an identical direction as the market.
To summarize the performance issue…
Relative to SPY during the 10-year period ended 9/30/2024, the funds average up capture (CAR) was only 65.97% while the down capture (MDD) was 116.01%.
To understand the value-add of these funds, I’d need to have a compelling reason that outweighs what we’ve observed so far. That the average fund looked at has had a 90% correlation to the S&P with only 66% of the return, and 116% of the drawdown.
Reasons for Underperformance
Now that the data has been thoroughly looked at, and SPY has been established as the correct benchmark, we can address two potential reasons why these funds have underperformed in both directions.
1. Added complexity means added costs
As these are derivative income funds, all the ETFs use an option strategy to generate additional income. This increases complexity, which increases fees.
Higher fees create a higher hurdle compared to the benchmark. Although higher fees aren’t inherently negative, the funds must provide value in exchange for them.
On average, the 10 derivative income funds shown have an expense ratio of 0.92% vs. SPY at 0.09%.
Given the average 0.90 correlation to SPY over the 10-year period ending 9/30/2024, the fees may be too steep for any meaningful value to be added.
Fees are only an issue in the absence of value…
2. The option strategies limit the upside
Most derivative income funds employ a covered call strategy to increase yield, which inherently limits upside potential.
Like buffered ETFs (for more on buffered ETFs, read here), the path of returns makes all the difference. In a market environment where stocks move sharply higher, these funds suffer as selling call options limits the upside.
On the downside, the income from the options sold can only cover so much of the loss. This means that at any given time, the downside potential is 100% minus the income that was generated.
As the data shows, the combination results in underperformance both on the upside and downside.
Think Critically
Popularity and $100 billion in AUM doesn’t exempt these funds from the need for critical evaluation.
By promoting high income, many ETFs have managed to mask significant underperformance on the upside, along with increased downside risk, while having a 0.90 correlation to the S&P 500.
Before chasing the yield, it is wise to examine the fund’s total return, risk, and correlation.
To hear how Potomac may be a solution to these problems, learn more about our tactical investment strategies.
By Tyler Lovingood
For more news, information, and analysis, visit the ETF Strategist Channel.
Disclosure Information
Potomac Fund Management (“Company”) is an SEC-registered investment adviser. SEC registration does not constitute an endorsement of the advisory firm by the SEC nor does it indicate that the advisory firm has attained a particular level of skill or ability. This information is prepared for general information only and should not be considered as individual investment advice nor as a solicitation to buy or offer to sell any securities. This material does not constitute any representation as to the suitability or appropriateness of any investment advisory program or security. Please visit our FULL DISCLOSURE page. The company does not make any representations or warranties as to the accuracy, timeliness, suitability, completeness, or relevance of any information prepared by any unaffiliated third party, whether linked to the Company website or incorporated herein, and takes no responsibility for any of this information. The views of the Company are subject to change and the Company is under no obligation to notify you of any changes. Different types of investments involve varying degrees of risk, and there can be no assurance that the future performance of any specific investment or investment strategy will be profitable or equal to any historical performance level.
PFM-370-20241101

