

How does fixed income typically behave during Fed interest rate cycles? We measured yield levels, curves, and credit spreads, as well as fixed income total returns over the past 32 years to determine performance during three periods: when the Fed lowers, raises, or holds steady its policy rate.
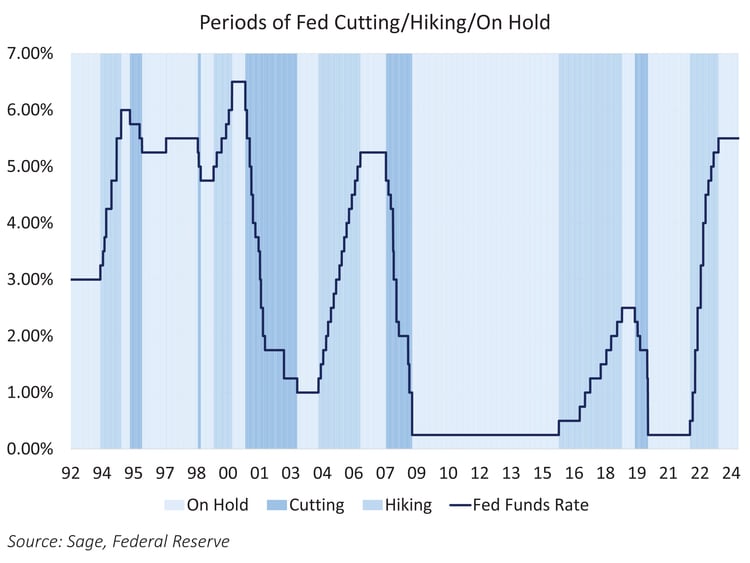
In order to define the different Fed rate regimes, we considered the “cutting” phase as the time from the first interest rate cut to the last cut (and vice versa for “hiking” cycles). The “on hold” regimes were defined as the time period in between the last interest rate cut to the first rate hike and vice versa. The hiking period is first hike to last hike, and so forth. The regimes were defined starting in 1992 (the earliest we could gather daily credit spread data).
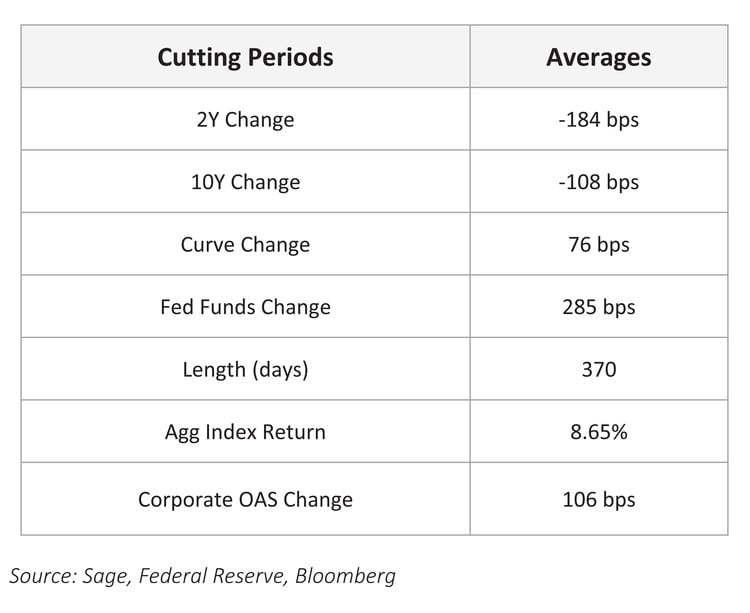
Cutting Phases: During historical cutting regimes, which on averaged lasted 370 days, the federal funds rate fell by an average of 285 bps. Bond yields were markedly lower across the curve, with the 2Y falling by 184 bps and the 10Y falling by 108 bps on average. The curve steepened, with the spread of the 10Y versus 2Y yields rising by 76 bps on average. Fixed income total returns were solid during cutting phases, with the average total return of the Aggregate Bond Index at +8.65%. Corporate option-adjusted spread (OAS) typically widened by 106 basis points on average as credit markets likely reflected the weak economic fundamentals that caused the Fed to cut interest rates.
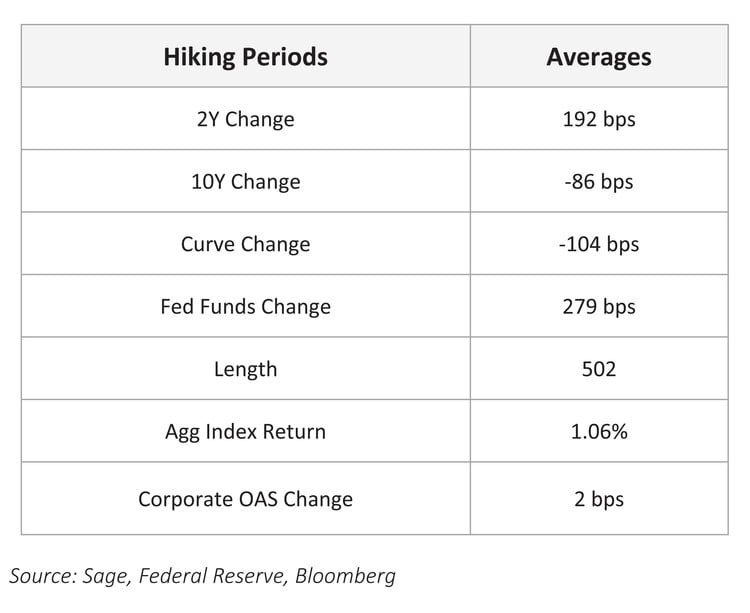
Hiking Phases: Hiking cycles since 1992 lasted an average of 502 days, over which time the fed funds rate rose by an average of 279 bps. Consequently, bond yields were higher, with the 2Y rising by 192 bps and the 10Y falling by 86 bps on average, while the spread of the 10Y versus 2Y yields flattened by an average of 104 bps. Fixed income total returns were lower, with the average total return of the Aggregate Bond Index at +1.06% during hiking phases. Corporate spreads were largely flat over this period.
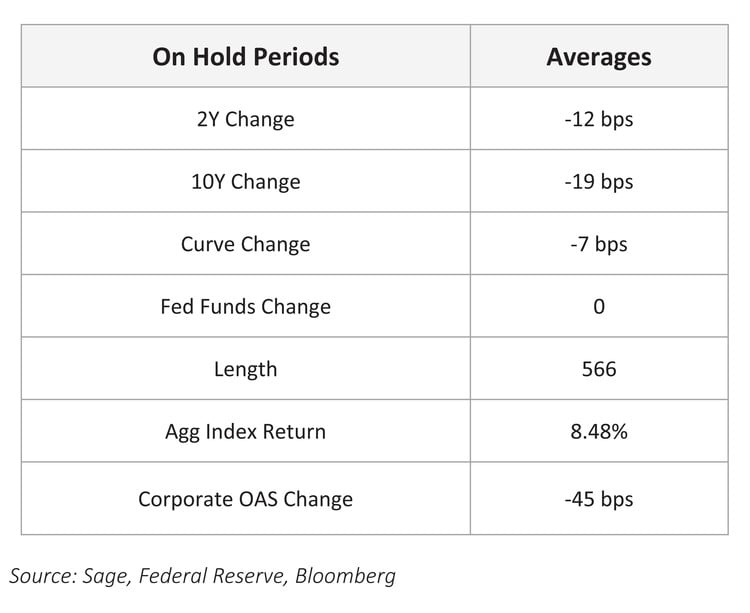
On Hold: The phases when the Fed was “on hold” in terms of interest rate changes typically lasted 566 days. Bond yields were rangebound over these periods as the change in yield levels and the yield curve were largely unchanged. Fixed income total returns were solid, with the average total return of the Aggregate Bond Index at +8.48% over this period. A large contributor was spread sectors, as investment grade corporate OAS tightened by an average of 0.45 bps over these on-hold phases.
Recent data releases have confirmed a downtrend in inflation and fading labor growth, all but ensuring a rate cut this fall, which the interest rate markets are pricing to occur in September. History has shown that rate cutting cycles typically favor lower yields and defensive positioning, which is a stance that we are continuing to express across our fixed income strategies.
For more news, information, and analysis, visit the ETF Strategist Channel.
Disclosures: This is for informational purposes only and is not intended as investment advice or an offer or solicitation with respect to the purchase or sale of any security, strategy or investment product. Although the statements of fact, information, charts, analysis and data in this report have been obtained from, and are based upon, sources Sage believes to be reliable, we do not guarantee their accuracy, and the underlying information, data, figures and publicly available information has not been verified or audited for accuracy or completeness by Sage. Additionally, we do not represent that the information, data, analysis and charts are accurate or complete, and as such should not be relied upon as such. All results included in this report constitute Sage’s opinions as of the date of this report and are subject to change without notice due to various factors, such as market conditions. Investors should make their own decisions on investment strategies based on their specific investment objectives and financial circumstances. All investments contain risk and may lose value. Past performance is not a guarantee of future results.
Sage Advisory Services, Ltd. Co. is a registered investment adviser that provides investment management services for a variety of institutions and high net worth individuals. For additional information on Sage and its investment management services, please view our web site at sageadvisory.com, or refer to our Form ADV, which is available upon request by calling 512.327.5530.

