

By Denis Rezendes, CFA, Partner, Portfolio Manager
2022 has been a difficult and frustrating year for many asset managers, ourselves included. The S&P 500 recently entered a bear market, falling 20% from its most recent peak. While this is far from uncharted territory, it’s notable that there have been few places to hide during the equity market’s decline. To illustrate this point, we analyzed the trailing twelve-month returns of all U.S. listed ETFs available at each point in time going back to the beginning of 2000.
While there have been notable areas with positive returns, primarily commodities, they are notable exactly because they are few and far between. On June 16th, the most recent low in the S&P 500 Index, just 9.9% of all U.S. listed ETFs had a positive trailing twelve-month return. This is the lowest percentage of ETFs with a positive trailing twelve-month return outside of the depths of the Great Recession in 2008.
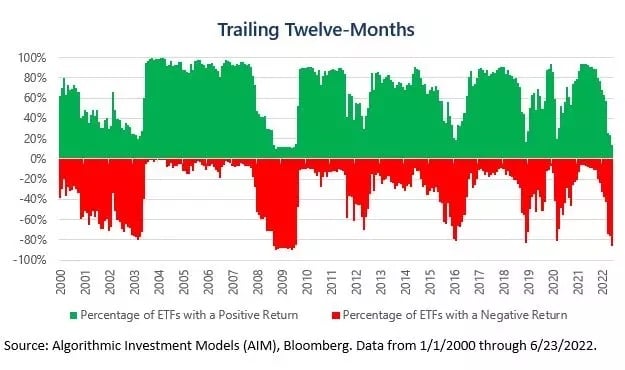
The percentage of ETFs with a positive trailing twelve-month return has rarely dipped below 20% and has only fallen below 10% three times outside of 2008. To add additional context, during the Great Recession the S&P 500 Index peaked in October of 2007. It took nearly nine months for the index to fall 20% from its peak, the line commonly used to denote a bear market. At that time, 25% of all U.S. listed ETFs had positive trailing twelve-month returns and, importantly, over this same time period the 10-Year Treasury Index rose 10%.
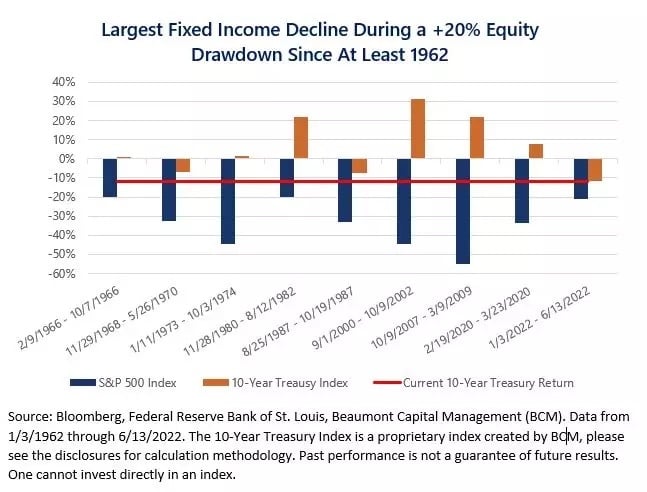
Fixed income is the asset class that investors and asset managers have historically relied on to manage volatility in their portfolios and smooth out the market’s gyrations. During this current drawdown in equity markets, fixed income has failed to act as a safe haven. As shown above, the 10-Year Treasury index has fallen by over 10%, which is the largest fall coincident with an equity drawdown since at least 1962. The combination of poor returns in fixed income coincident with a drawdown in equity markets has led to disappointing returns for many investors. This is particularly true in conservative portfolio allocations which have experienced declines consistent with a much larger drop in the equity markets historically.
It’s clear that there’s not much to be happy about when looking backwards, but the future may be brighter. Even if the overall market stays flat or trends down further, with so many asset classes beaten up, history suggests that at some of them may begin to trend in a positive direction. Staying invested and diversified may be the best chance to capture these opportunities for gains through mean reversion.
This article was contributed by Beaumont Capital Management (BCM), a participant in the ETF Strategist Channel.
For more insights like these, visit BCM’s blog at blog.investbcm.com.
Disclosures
Copyright © 2022 Beaumont Capital Management LLC. All rights reserved. All materials appearing in this commentary are protected by copyright as a collective work or compilation under U.S. copyright laws and are the property of Beaumont Capital Management. You may not copy, reproduce, publish, use, create derivative works, transmit, sell or in any way exploit any content, in whole or in part, in this commentary without express permission from Beaumont Capital Management.
The charts and infographics are based on data obtained from third parties and are believed to be accurate. The commentary included is the opinion of the author and subject to change at any time. Any reference to specific securities or investments are for illustrative purposes only and are not intended as investment advice nor are they a recommendation to take any action. Past performance is no guarantee of future results.
BCM’s proprietary 10-Year Treasury Index is calculated using the Board of Governors of the Federal Reserve System (US), Market Yield on U.S. Treasury Securities at 10-Year Constant Maturity series. The Index’s daily return is the price change of a 10-year treasury bond issued at the prior day’s yield, plus any accrued interest.

