

Key Takeaways:
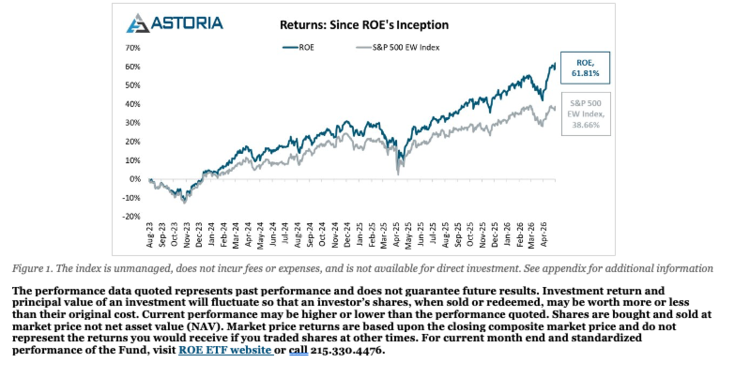
On a cumulative basis, ROE has returned 61.81% (market) and 61.74% (NAV) since inception (July 31, 2023) through April 30, 2026, outperforming the S&P 500 Equal Weight Index’s 38.66% return over the same period by a factor of 1.60×. On a 1-year basis, ROE has returned 35.88% (market) and 35.82% (NAV) through April 30, 2026, outperforming the S&P 500 Equal Weight Index’s 22.56% return over the same period by a factor of 1.59×.
Quality screening favors companies with high return on equity (ROE) and return on invested capital (ROIC), characteristics that have historically been associated with stronger risk-adjusted returns over time.
Sector-optimized construction differentiates ROE from traditional equal-weight indices, particularly in the Information Technology and Communication Services sectors.
The Astoria US Equal Weight Quality Kings ETF (ROE) invests in up to 100 of the highest quality US large-cap and mid-cap stocks, applying a quality-driven screening process built on equal-weight, sectoroptimized construction. ROE aims to address two potential pitfalls of market-cap-weight indexing and simple equal-weight indexing: top-heavy concentration risk and the indiscriminate inclusion of lowerquality businesses.
Relative to the S&P 500 Equal Weight Index, ROE has delivered notable outperformance since inception. This result is driven by a disciplined quality-focused process for selecting 100 high-quality US large- and mid-cap stocks and sector-aware construction.
The Quality Factor: A Historical Edge
The quality factor defines profitable, robust companies able to persist through varying economic cycles. Across many widely accepted metrics used to define quality, higher quality companies have historically delivered superior risk-adjusted returns, as measured by higher Sharpe ratios over time.
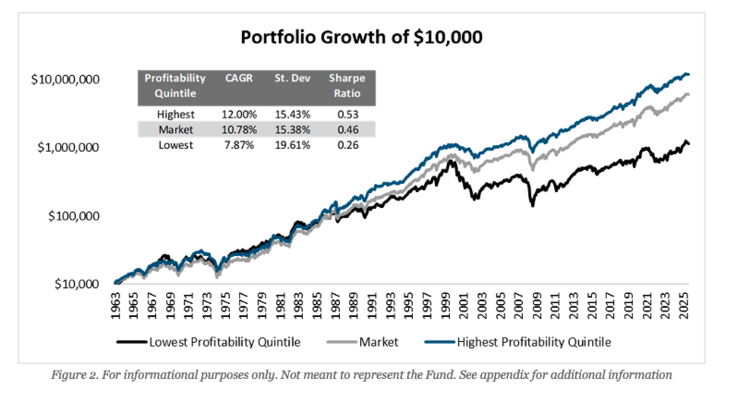
Using the Kenneth French Data Library operating profitability factor returns from July 1963 through February 2026, the highest quintile of companies sorted by operating profitability has outperformed the broader market by a factor of 1.98x and has outperformed the lowest quintile of companies sorted by operating profitability by a factor of 10.50×. The highest quintile of companies has simultaneously produced the largest compound annual growth rate (CAGR) and the highest Sharpe ratio, with a risk-return profile comparable to the broader market.
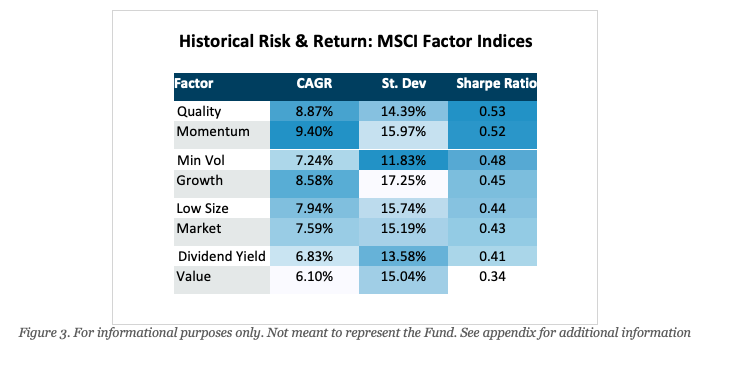
Moreover, a quality framework remains appealing when observing historical risk and return statistics across MSCI factor indices. From the period starting January 1999 through March 2026, the quality factor ultimately produced the highest Sharpe ratio of all factor indices, making it attractive from a risk-adjusted return standpoint on a factor-relative basis.
Discipline Meets Design
ROE selects companies to invest in based on rigorous screening criteria. From this starting universe of 800 or so stocks that pass minimum free float shares, market capitalization, and average volume constraints, stocks are picked across all Global Industry Classification Standard (GICS) sectors using sector-relative metrics weighted primarily toward quality, with additional consideration for valuation, growth, and dividend potential. Sector-relative metrics are those that have best historically defined quality for that sector are the ones used for that specific sector. Prior to ranking, each metric is adjusted by the respective sector’s median on a sector-by-sector basis. Fundamentally, this methodology avoids the common pitfall of factor strategies that systematically overweight or underweight entire sectors based on factor definitions designed for the average stock. The top-ranked 100 names are then selected in a sectoroptimized fashion, relative to the broad US equity market, with each constituent receiving an equal 1% weight at rebalance.
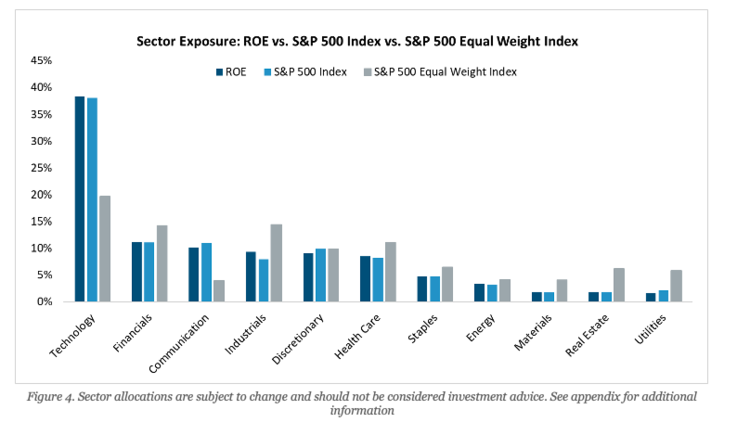
In Astoria’s view, while individual holdings should be equally weighted to mitigate single-name concentration risk, sector exposures should be explicitly anchored to the broad US equity market via the S&P 500 Index rather than left to chance. The S&P 500 Equal Weight Index, for example, simply takes the 500 stocks in the S&P 500 and equal weights them, resulting in unintended sector tilts driven by however many names happen to fall in each sector. In practice, this means ROE’s sector allocation closely mirrors that of the market-cap weighted S&P 500, while still reducing the concentration risk inherent in it.
Across nearly every sector, ROE and the S&P 500 Index sit within less than one percentage point of each other, including Information Technology (38.9% vs. 38.1%), Communication Services (10.2% vs. 11.1%), and Consumer Discretionary (9.0% vs. 9.9%). By contrast, the S&P 500 Equal Weight Index allocates materially differently from the broader market: Information Technology is cut roughly in half (19.7%), Communication Services is less than half (4.0%), and structural overweights emerge in areas such as Industrials, Real Estate, and Utilities.
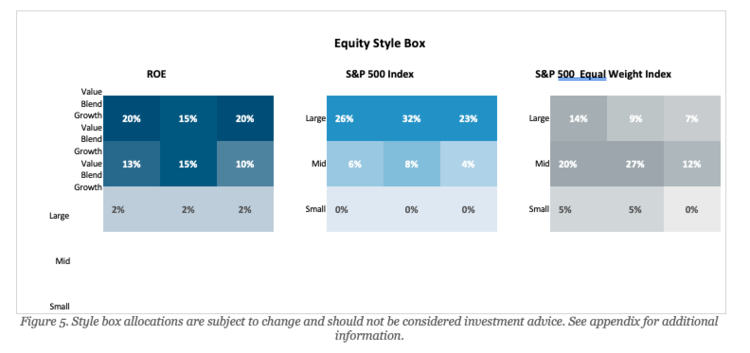
The equity style box tells a similar story. Because ROE equal-weights its 100 holdings, it naturally shifts exposure down the market-cap spectrum relative to the S&P 500 Index, where mega-cap names dominate. ROE allocates roughly 55% to large-caps, 38% to mid-caps, and 6% to small-caps, compared to the S&P 500 Index, which concentrates approximately 81% in large-caps with virtually no small-cap exposure. At the same time, ROE mitigates the dramatic mid-cap tilt seen in the S&P 500 Equal Weight Index, which pushes nearly 59% of its weight into mid-caps and only 30% into largecaps. ROE is a more balanced distribution across the size spectrum, giving investors meaningful midcap diversification without abandoning the large-cap core that drives most US equity returns.
Why It Matters for Investors
- Concentration risk mitigation: equal weighting avoids the concentration risk associated with market cap-weighting and reduces the dominance of the largest names in core US equity indices.
- Quality premium capture: higher-quality companies have historically delivered superior risk-adjusted returns relative to the broader market.
- Sector-optimized to the broad market: sector exposures are anchored to the broader US equity market, not equally distributed across sectors; differentiation occurs at the stock-selection level.
Use case flexibility: ROE can be used as a complement to many portfolio strategies, including US large-cap and mid-cap core equity exposure, a quality satellite, or a growth-oriented allocation.
For more news, information, and analysis, visit the ETF Strategist Content Hub.
Definitions of Terms
Return on Equity (ROE). ROE is a ratio that measures the net income of a company in relation to its average equity over the trailing 12 months. The ratio provides insight into how efficient management has been in generating income from shareholder equity.
Return on Invested Capital (ROIC). ROIC is a ratio that measures the net income of a company in relation to its average total invested capital over the trailing 12 months. The ratio provides insight into how effectively management has been at allocating capital to generate profitable returns, regardless of how the business is financed.
Operating Profitability. Operating profitability, according to Fama and French (2015), is calculated using all accounting numbers from the end of the previous fiscal year. It is defined by annual revenues minus the cost of goods sold, interest expenses, and selling, general, and administrative expenses, divided by book equity.
Compound Annual Growth Rate (CAGR). CAGR is the mean annual growth rate of an investment over a specified period of time longer than one year. It is the rate of return that would be required for an investment to grow from its beginning balance to its ending balance, assuming the profits were reinvested at the end of each period of the investment’s life span.
Standard Deviation (St. Dev.). The standard deviation of a portfolio measures how much the investment returns deviate from the mean of the probability distribution of investments. It tells investors how much the investment will deviate from its expected return. Investors can use this metric to help determine an investment or portfolio’s annual return by considering its historical volatility.
Sharpe Ratio. The Sharpe ratio is a risk-adjusted measure calculated using annualized standard deviation and excess return to determine reward per unit of risk. The higher the Sharpe ratio, the better the historical risk-adjusted performance.
Free Float. Free float refers to the portion of a company’s shares that are available for trading in the public market, excluding shares held by insiders, controlling shareholders, or other parties that are not actively traded.
Equity Style Box. A classification framework that categorizes equity holdings by market capitalization and investment style. Large cap represents the top 70% of cumulative market capitalization, mid cap the next 20%, and small cap the remaining balance. Value orientation is based on price-to-earnings, price-to-book, price-to-sales, price-to-cash flow, and dividend yield. Growth orientation is based on projected and historical earnings growth, sales growth, cash flow growth, and book value growth. Blend reflects a mix of both without a meaningful tilt toward either style.
Definitions of Indices
S&P 500 Index. The S&P 500 is widely regarded as the best single gauge of large-cap US equities. The index includes 500 leading companies and covers approximately 80% of available market capitalization. It is weighted by float-adjusted market capitalization.
S&P 500 Equal Weight Index. The S&P 500 Equal Weight Index (EWI) is the equal-weight version of the widely used S&P 500. The index includes the same constituents as the capitalization-weighted S&P 500, but each company in the S&P 500 EWI is allocated a fixed weight of approximately 0.2% of the index total at each quarterly rebalance.
MSCI USA Index. The MSCI USA Index is designed to measure the performance of the large- and mid-cap segments of the US market. It covers approximately 85% of the free float-adjusted market capitalization in the US.
MSCI USA Quality Index. The MSCI USA Quality Index is based on the MSCI USA Index. It aims to capture the performance of quality growth stocks by identifying stocks with high quality scores based on three main fundamental variables: high return on equity (ROE), stable year-over-year earnings growth, and low financial leverage.
MSCI USA Growth Index. The MSCI USA Growth Index captures large- and mid-cap securities exhibiting overall growth style characteristics in the US. The growth investment style characteristics for index construction are defined using five variables: longterm forward EPS growth rate, short-term forward EPS growth rate, current internal growth rate, long-term historical EPS growth trend, and long-term historical sales per share growth trend.
MSCI USA Value Index. The MSCI USA Value Index captures large- and mid-cap US securities exhibiting overall value style characteristics. The value investment style characteristics for index construction are defined using three variables: book value to price, 12-month forward earnings to price, and dividend yield.
MSCI USA Momentum Index. The MSCI USA Momentum Index is based on the MSCI USA Index. It is designed to reflect the performance of an equity momentum strategy by emphasizing stocks with high price momentum, while maintaining reasonably high trading liquidity, investment capacity, and moderate index turnover.
MSCI USA High Dividend Yield Index. The MSCI USA High Dividend Yield Index is based on the MSCI USA Index and includes large- and mid-cap stocks. The index is designed to reflect the performance of equities in the parent index (excluding REITs) with higher dividend income and quality characteristics than average, and dividend yields that are both sustainable and persistent. The index also applies quality screens and reviews 12-month past performance to omit stocks with potentially deteriorating fundamentals that could force them to cut or reduce dividends.
MSCI USA Minimum Volatility Index. The MSCI USA Minimum Volatility (USD) Index aims to reflect the performance characteristics of a minimum-variance strategy applied to the large- and mid-cap USA equity universe. The index is calculated by optimizing the MSCI USA Index for the lowest absolute risk within a given set of constraints. Historically, the index has shown lower beta and volatility characteristics relative to the MSCI USA Index.
MSCI USA Size Tilt Index. The MSCI USA Size Tilt Index is based on the MSCI USA Index. It aims to reflect the performance of a low-size strategy with relatively high investment capacity. The index is created by including all the constituents in the parent index and weighting the constituents using the square root of their market capitalization weight.
Appendix: Figure Sources & Information
[Fig. 1] Source: FactSet, Astoria Portfolio Advisors. Data as of April 30, 2026. Chart shows returns since ROE’s inception on a daily frequency from July 31, 2023 through April 30, 2026. Past performance is not indicative of future results. The index is unmanaged, does not incur fees or expenses, and is not available for direct investment.
[Fig. 2] Source: Kenneth French Data Library, Astoria Portfolio Advisors. Data from July 1963, through February 2026, for which operating profitability returns were available. Chart represents the performance of a hypothetical $10,000 investment in highest and lowest quintiles and the market from July 1963, through February 2026, and uses monthly returns. Compound Annual Growth Rate (CAGR), Standard Deviation (St. Dev) and Sharpe Ratio are all annualized. Past performance is not indicative of future results. For informational purposes only. Not meant to represent the Fund.
[Fig. 3] Source: FactSet, Astoria Portfolio Advisors. Data from January 1999, through March 2026. Performance calculations use net monthly returns. Compound Annual Growth Rate (CAGR), Standard Deviation (St. Dev) and Sharpe Ratio are all annualized. For Growth, Quality, Value, Momentum, Dividend Yield, Minimum Volatility (Min Vol), Low Size, and Market, the following indices were used in respective order: MSCI USA Growth Index, MSCI USA Quality Index, MSCI USA Value Index, MSCI USA Momentum Index, MSCI USA High Dividend Yield Index, MSCI USA Minimum Volatility Index, MSCI USA Size Tilt Index, MSCI USA Index. Past performance is not indicative of future results. Indices are typically not available for direct investment, are unmanaged, and do not incur fees or expenses. For informational purposes only. Not meant to represent the Fund.
[Fig. 4] Source: FactSet, Astoria Portfolio Advisors. Data as of May 14, 2026. Sector allocations are subject to change and should not be considered investment advice.
[Fig. 5] Source: Vanguard, Morningstar, Astoria Portfolio Advisors. Data accessed on May 15, 2026. Style box compositions are subject to change and should not be considered investment advice.
Important Information
This material must be preceded or accompanied by a prospectus. Please read the prospectus carefully before investing. The Funds’ investment objectives, risks, charges, and expenses must be considered carefully before investing. Click here for the ROE Prospectus and Summary Prospectus. All fund documents can be found at www.astoriaadvisorsETFs.com. A free hardcopy of any prospectus may be obtained by calling 215.330.4476. Not FDIC/NCUA Insured | Not a Deposit | May Lose Value | No Bank Guarantee | Not Insured | Past Performance is
Not Indicative of Future Returns
Principal Risks
Quality Stocks Risk. Stocks included in the Fund are deemed by the Sub-Adviser to be quality stocks, but there is no guarantee that the past performance of these stocks will continue. Companies that issue these stocks may experience lower than expected returns or may experience negative growth, as well as increased leverage, resulting in lower than expected or negative returns to Fund shareholders. Many factors can affect a stock’s quality and performance, and the impact of these factors on a stock or its price can be difficult to predict.
Management Risk. The Fund is actively managed and may not meet its investment objective based on the Adviser’s or Sub-Adviser’s success or failure to implement investment strategies for the Fund. The success of the Fund’s investment program depends largely on the investment techniques and risk analyses applied by the Sub-Adviser, including the use of quantitative models or methods. It is possible the investment techniques and risk analyses employed on behalf of the Fund will not produce the desired results.
Value-Style Investing Risk. The Sub-Adviser may be wrong in its assessment of a company’s value, and the stocks the Fund owns may not reach what the Sub-Adviser believes are their true values. The market may not favor value-oriented stocks and may not favor equities at all, which may cause the Fund’s relative performance to suffer. Value stocks can perform differently from the market as a whole and from other types of stocks. While certain value stocks may increase in value more quickly during periods of anticipated economic upturn, they may also lose value more quickly in periods of anticipated economic downturn. Furthermore, there is the risk that the factors which caused the depressed valuations are longer term or even permanent in nature, and that their valuations may fall or never rise.
Dividend-Paying Common Stock Risk. The Fund will normally receive income from dividends that are paid by issuers of the Fund’s investments. The amount of the dividend payments may vary and depends on performance and decisions of the issuer. Poor performance by the issuer or other factors may cause the issuer to lower or eliminate dividend payments to investors, including the Fund. Additionally, these types of securities may fall out of favor with investors and underperform the broader market.
Quantitative Security Selection Risk. Data for some companies may be less available and/or less current than data for companies in other markets. The Sub-Adviser uses quantitative analysis, and its processes could be adversely affected if erroneous or outdated data is utilized. The securities selected using quantitative analysis could perform differently from the financial markets as a whole as a result of the characteristics used in the analysis, the weight placed on each characteristic and changes in the characteristic’s historical trends. In addition, the investment analysis used in making investment decisions may not adequately consider certain factors, or may contain design flaws or faulty assumptions, any of which may result in a decline in the value of an investment in the Fund.
Cash and Cash Equivalents Risk. Holding cash or cash equivalents rather than securities or other instruments in which the Fund primarily invests, even strategically, may cause the Fund to risk losing opportunities to participate in market appreciation, and may cause the Fund to experience potentially lower returns than the Fund’s benchmark or other funds that remain fully invested. In rising markets, holding cash or cash equivalents will negatively affect the Fund’s performance relative to its benchmark.
Premium-Discount Risk. The Shares may trade above or below their NAV. The NAV of the Fund will generally fluctuate with changes in the market value of the Fund’s holdings. The market prices of Shares, however, will generally fluctuate in accordance with changes in NAV as well as the relative supply of, and demand for, Shares on the Exchange and other securities exchanges. The existence of significant market volatility, disruptions to creations and redemptions, or potential lack of an active trading market for Fund Shares (including through a trading halt), among other factors, may result in the Shares trading significantly above (at a premium) or below (at a discount) to NAV. If you buy Fund Shares when their market price is at a premium or sell the Fund Shares when their market price is at a discount, you may pay more than, or receive less than, NAV, respectively. The Adviser cannot predict whether Shares will trade below, at, or above their NAV. Price differences may be due, in large part, to the fact that supply and demand forces at work in the secondary trading market for Shares will be closely related to, but not identical to, the same forces influencing the prices of the securities held by the Fund. However, given that Shares can be purchased and redeemed in large blocks of Shares, called Creation Units (unlike shares of closed-end funds, which frequently trade at appreciable discounts from, and sometimes at premiums to, their NAV), and the Fund’s portfolio holdings are fully disclosed on a daily basis, the Adviser believes that large discounts or premiums to the NAV of Shares should not be sustained, but that may not be the case.
An investment in the Fund involves risk, including possible loss of principal. Exchange-traded funds (ETFs) trade like stocks, are subject to investment risk, fluctuate in market value and may trade at prices above or below the ETF’s net asset value (NAV), and are not individually redeemable directly with the ETF. Brokerage commissions and ETF expenses will reduce returns. ETFs are subject to specific risks, depending on the nature of the underlying strategy of the Fund, which should be considered carefully when making investment decisions. For a complete description of the Funds’ principal investment risks, please refer to the prospectus.
Shares of the Funds Are Not FDIC Insured, May Lose Value, and Have No Bank Guarantee.
The Fund is distributed by PINE Distributors LLC. The Fund’s investment advisor is Empowered Funds, LLC, which is doing business as ETF Architect. Astoria Portfolio Advisors, LLC serves as the Sub-adviser to the Fund. PINE Distributors LLC is not affiliated with ETF Architect or Astoria Portfolio Advisors, LLC. ETFAC-5511181-05/26
There are no warranties implied. Astoria Portfolio Advisors LLC is a registered investment adviser located in New York. Astoria Portfolio Advisors LLC may only transact business in those states in which it is registered or qualifies for an exemption or exclusion from registration requirements. Astoria Portfolio Advisors LLC’s web site is limited to the dissemination of general information pertaining to its advisory services, together with access to additional investment-related information, publications, and links. Accordingly, the publication of Astoria Portfolio Advisors LLC’s web site on the Internet should not be construed by any consumer and/or prospective client as Astoria Portfolio Advisors LLC’s solicitation to effect, or attempt to effect transactions in securities, or the rendering of personalized investment advice for compensation, over the Internet. Any subsequent, direct communication by Astoria Portfolio Advisors LLC with a prospective client shall be conducted by a representative that is either registered or qualifies for an exemption or exclusion from registration in the state where the prospective client resides.
A copy of Astoria Portfolio Advisors LLC’s current written disclosure statement discussing Astoria Portfolio Advisors LLC’s business operations, services, and fees is available at the SEC’s investment adviser public information website – www.adviserinfo.sec.gov or from Astoria Portfolio Advisors LLC upon written request. Astoria Portfolio Advisors LLC does not make any representations or warranties as to the accuracy, timeliness, suitability, completeness, or relevance of any information prepared by any unaffiliated third party, whether linked to Astoria Portfolio Advisors LLC’s web site or incorporated herein and takes no responsibility therefor. All such information is provided solely for convenience purposes only and all users thereof should be guided accordingly. This website and information presented is for educational purposes only and does not intend to make an offer or solicitation for the sale or purchase of any specific securities, investments, or investment strategies. Investments involve risk and unless otherwise stated, are not guaranteed. Be sure to first consult with a qualified financial adviser and/or tax professional before implementing any strategy. This website and information are not intended to provide investment, tax, or legal advice.
Past performance is not indicative of future performance. Indices are typically not available for direct investment, are unmanaged, and do not incur fees or expenses. This information contained herein has been prepared by Astoria Portfolio Advisors LLC on the basis of publicly available information, internally developed data and other third-party sources believed to be reliable. Astoria Portfolio Advisors LLC has not sought to independently verify information obtained from public and third-party sources and makes no representations or warranties as to accuracy, completeness, or reliability of such information. All opinions and views constitute judgments as of the date of writing without regard to the date on which the reader may receive or access the information and are subject to change at any time without notice and with no obligation to update. Any ETF Holdings shown are for illustrative purposes only and are subject to change at any time. This material is for informational and illustrative purposes only and is intended solely for the information of those to whom it is distributed by Astoria Portfolio Advisors LLC. No part of this material may be reproduced or retransmitted in any manner without the prior written permission of Astoria Portfolio Advisors LLC. Investing entails risks, including possible loss or some or all of the investor’s principal. The investment views and market opinions/analyses expressed herein may not reflect those of Astoria Portfolio Advisors LLC as a whole and different views may be expressed based on different investment styles, objectives, views, or philosophies. To the extent that these materials contain statements about the future, such statements are forward looking and subject to a number of risks and uncertainties.

