

As the November elections approach, there has been significant debate over which presidential candidate — former President Donald Trump or Vice President Kamala Harris — would be better for US equity markets. Both candidates have made bold promises about their plans to boost national prosperity. Trump has vowed to reduce burdensome regulations and deliver tax cuts to households and businesses, while Harris has advocated tax incentives for homebuilders to boost supply, address housing affordability, and help bring down the cost of living.
While both candidates have reasonable policy goals but differing policy prescriptions, their overall impact on investor portfolios may likely be similar. Contrary to popular belief, presidents have had limited influence on equity returns. An analysis of the S&P 500’s performance from 1930 to 2023 shows that stocks have provided a return of about 30%, on average, over a typical four-year term, with the returns under Republican presidents only slightly topping the returns under Democrats.
The key reason for the similar outcome is that presidents are often constrained by the conditions they inherit. These include the state of the economy, the composition of Congress, and monetary policy. While a president may have some influence over these factors, their ability to shape them is largely determined by the circumstances they receive in the election. A popular president may secure a Congress with a substantial majority, enabling them to pass key legislation and select their preferred candidate as the chair of the Federal Reserve. That said, such a strong majority with unified government is not the norm.
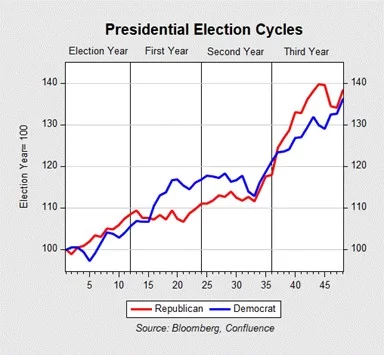
Historically, stock market performance during US presidential election years has been influenced by the broader economic trends in place at the time. While equities under Republican administrations often outperform Democratic administrations in election years, Democrats close the gap over the first and second years following the election. This tendency is largely attributed to the economic conditions that new Democratic presidents frequently inherit. Democrat victories often coincide with economic downturns, allowing for stimulus measures that eventually help asset prices recover. Conversely, Republican administrations tend to benefit from a “continuity rally” following the positive economic performance in the year prior to the election.
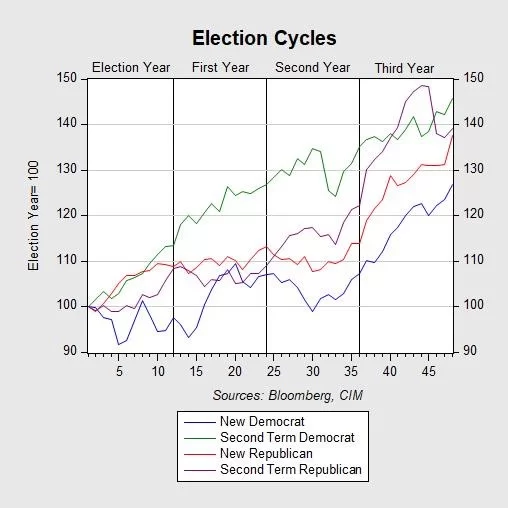
During their first year, Democrats tend to get off to a better start but ultimately suffer the same fate of stagnation. New presidents often enjoy greater flexibility to provide more fiscal and monetary stimulus, helping to improve the economy. This can boost market optimism. By their second term, however, leaders typically face diminished support, making it more difficult to pass significant legislation in the first year. This predictability, while not without its challenges, can often be positive for equities.
In contrast, new Republican administrations often inherit a tougher policy environment in the first year, marked by higher inflation and tighter monetary policies. Historically, average policy rates have been roughly three times higher under Republicans (7.8%) than under Democrats (2.4%); inflation rates have also been higher (5.1% vs. 3.0%, respectively). With the exception of the Nixon-Ford administration, second-term Republican presidents generally fare better than their first-term counterparts, for similar reasons as second-term Democrats.
In the following year, midterm elections significantly shape market sentiment as Congress goes through a reshuffle. Democrats often get the worst of it and lose an average of 28 House seats and 3 Senate seats, while Republicans typically lose 21 House seats and 1 Senate seat. This shift in Congress leads to concerns about the future of recent policy decisions by Democrats, creating uncertainty as markets gauge the potential impact on future policy. Conversely, Republicans’ relative successes in midterms often signal confidence in the president’s leadership, boosting expectations of policy continuity and benefiting equities.
The third year of a presidential term, leading up to the election, often sees strong economic performance for both parties. This trend can partly be attributed to political gridlock, which limits major legislative changes and creates a stable environment favorable to the stock market. While brief market dips may occur, particularly under Democratic presidents due to budget negotiations that introduce uncertainty, these downturns are typically followed by a rebound, reflecting investors’ confidence in the broader economic trajectory.
In sum, presidents are often labeled as either pro-market or anti-market, but research suggests that their influence on the economy and stock market is often overestimated. A president’s first year is typically focused on addressing ongoing economic challenges. The second year can be more uncertain, as the composition of Congress is solidified. The third year often sees a boost in the market because of investors’ preference for political gridlock. For investors, this election cycle highlights the importance of focusing on broader economic factors, monetary policy, and the composition of Congress. While the presidency can play a role, it’s essential to consider the bigger picture.
By the Asset Allocation Committee
For more news, information, and analysis, visit the ETF Strategist Channel.
Disclosure Information
These reports were prepared by Confluence Investment Management LLC and reflect the current opinion of the authors. Opinions expressed are current as of the date shown and are based upon sources and data believed to be accurate and reliable. Opinions and forward-looking statements expressed are subject to change. This is not a solicitation or an offer to buy or sell any security. Past performance is no guarantee of future results. Information provided in this report is for educational and illustrative purposes only and should not be construed as individualized investment advice or a recommendation. Investments or strategies discussed may not be suitable for all investors. Investors must make their own decisions based on their specific investment objectives and financial circumstances.

