

‘Growth’ Themes Continue Market Dominance
SUMMARY
- ‘Growth’ remains king in the US.
- China posts best return in our global universe.
- Earnings continue to be key input for future investment.
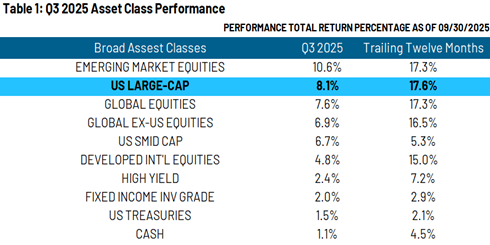
In the third quarter of 2025, ‘growth’ themes1 that started to regain their mojo in the 2nd quarter reclaimed their leadership for the year. Growth-heavy markets of China and the US saw strong returns, while the more value-oriented European markets posted weaker returns compared to the previous quarter. In RiverFront’s view, this strength is primarily related to corporate earnings. Growth-leaning sectors continue to see strong earnings trends, while despite an improving macro environment for value stocks, value companies’ earnings growth has yet to come to fruition. Let’s take a deeper dive into these returns to see how these themes played out.
US Sectors: Growth Continues to Drive the Market
Table 2, at the top of the next page, shows US sector performance. As we discussed last quarter, while the quarter-to-quarter returns may feel like a tug-of-war between ‘growth’ and ‘value’, when we zoom out it can be viewed more as volatility around a secular ‘growth’ mega trend. This pattern is further displayed in the third quarter’s returns, with three of the primary ‘growth’ sectors (tech, communication services and consumer discretionary) posting returns above the index. Furthermore, these returns are backed up in strong earnings trends, in our view. As such, we remain overweight US ‘growth’ themes relative to our global benchmarks across each of our model portfolios.
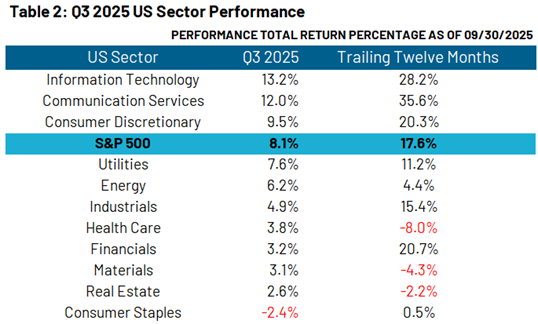
Looking at the bottom of the table, we see several ‘defensive’ sectors which posted a negative return, led on the downside by consumer staples. We believe that this underperformance was driven by two factors. First, these sectors had strong returns earlier in the year, as the market attempted to hedge against market volatility caused by tariffs. As the market continues to look past tariffs, investors become more willing to move on from these hedges. Second, we believe that there are specific macro headwinds that these sectors face. For staples specifically, our view is that the past year of elevated inflation has begun to eat into margins and with tariffs still looming, we do not see any reprieve on the horizon. Again, this is a trend that we see corroborated in earnings, with staples being one of three US sectors that had negative year-over-year earnings growth (the other two being Energy and Materials).
International Stocks: China Leads, While the Dollar Stabilizes
Moving to Table 3 (below), Chinese equities led the way for international markets. This is another example of the ‘growth’ rally we saw in the US, with China being one of the rare technology-heavy indices in the international space. Despite these strong returns, we remain cautious about Chinese equities. We view the risks caused by China’s geopolitical posturing and the China Communist Party (CCP’s) track record of market-negative actions (especially towards foreign investors) as legitimate and believe that a discount should be applied to China’s market multiples. Taking all of that into consideration, we remain long-term cautious on Chinese stocks.
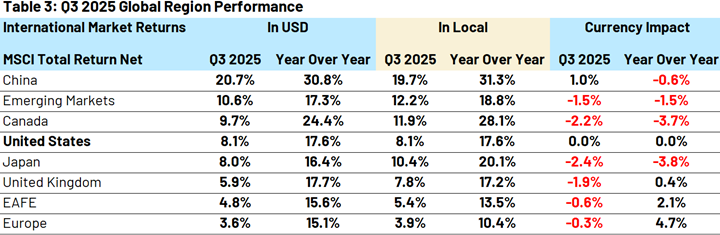
The other international market that had returns above the US was Canada. While the Canadian dollar continued to weaken relative to the US dollar, local equity returns made up most of the US investor’s return. This rally in Canadian equities is a continuation of strong returns from the second quarter and, in our view, is a result of strong precious metal prices.
Finally, on the currency front, the US dollar seems to have found some stability, at least for the moment. After two strong quarters for foreign currencies, the dollar strengthened against each currency in our universe apart from the Chinese Yuan, which notably did not participate in the rally.
Looking Forward: Continuing to Watch Earnings
Running the risk of sounding like a broken record, when we consider the past quarter of market returns in the context of looking forward, earnings remain the predominant catalyst for further upside in markets. When we look at the current macro-economic environment and the general dovishness of central bank policy, there are reasons to believe ‘value’ equities, including small-cap and international, should start to see tailwinds in the coming quarters. Specifically, we believe a backdrop of moderately elevated inflation and expansionary global central bank policy should both be big boosts to the cyclical ‘value’ business model.
However, we continue to see stronger earnings in ‘growth’ themes than in ‘value’ ones so far. When we combine these strong earnings with strong market returns, it is hard to argue against ‘growth’ equities right now. However, we are also aware that growth equities will not sustain their earnings growth or their rates of returns indefinitely. Thus, we must remain vigilant in our earnings framework and continue to be receptive towards a ‘value rotation’ if we begin to see it burgeoning in earnings data.
Originally published by Riverfront Investment Group
For more news, information, and analysis, visit the ETF Strategist Content Hub.
1 At Riverfront, we generally categorize the Technology, Communication Services, and Consumer Discretionary sectors as ‘growth’ sectors and the Energy, Industrials, Materials, and Financials sectors as ‘value’ sectors.
Risk Discussion: All investments in securities, including the strategies discussed above, include a risk of loss of principal (invested amount) and any profits that have not been realized. Markets fluctuate substantially over time, and have experienced increased volatility in recent years due to global and domestic economic events. Performance of any investment is not guaranteed. In a rising interest rate environment, the value of fixed-income securities generally declines. Diversification does not guarantee a profit or protect against a loss. Investments in international and emerging markets securities include exposure to risks such as currency fluctuations, foreign taxes and regulations, and the potential for illiquid markets and political instability. Please see the end of this publication for more disclosures.
Important Disclosure Information
The comments above refer generally to financial markets and not RiverFront portfolios or any related performance. Opinions expressed are current as of the date shown and are subject to change. Past performance is not indicative of future results and diversification does not ensure a profit or protect against loss. All investments carry some level of risk, including loss of principal. An investment cannot be made directly in an index.
Information or data shown or used in this material was received from sources believed to be reliable, but accuracy is not guaranteed.
This report does not provide recipients with information or advice that is sufficient on which to base an investment decision. This report does not take into account the specific investment objectives, financial situation or need of any particular client and may not be suitable for all types of investors. Recipients should consider the contents of this report as a single factor in making an investment decision. Additional fundamental and other analyses would be required to make an investment decision about any individual security identified in this report.
Chartered Financial Analyst is a professional designation given by the CFA Institute (formerly AIMR) that measures the competence and integrity of financial analysts. Candidates are required to pass three levels of exams covering areas such as accounting, economics, ethics, money management and security analysis. Four years of investment/financial career experience are required before one can become a CFA charterholder. Enrollees in the program must hold a bachelor’s degree.
All charts shown for illustrative purposes only. Technical analysis is based on the study of historical price movements and past trend patterns. There are no assurances that movements or trends can or will be duplicated in the future.
Technology and internet-related stocks, especially of smaller, less-seasoned companies, tend to be more volatile than the overall market.
Index Definitions
Standard & Poor’s (S&P) 500 Index TR USD (US Large Cap) measures the performance of 500 large cap stocks, which together represent about 80% of the total US equities market.
Standard & Poor’s (S&P) 1000 Index (US SMID Cap) – the S&P MidCap 400 Index and the S&P SmallCap 600 Index are combined to form the S&P 1000.
MSCI EAFE Index NR USD (Developed International Equities) is designed to represent the performance of large and mid -cap securities across approximately 21 developed markets, including countries in Europe, Australasia and the Far East, excluding the US and Canada. Net total return indices reinvest dividends after the deduction of withholding taxes, using (for international indices) a tax rate applicable to nonresident institutional investors who do not benefit from double-taxation treaties.
MSCI Emerging Markets Index captures large and mid cap representation across approximately 26 Emerging Markets (EM) countries.
MSCI Europe Index represents the performance of large and mid-cap equities across approximately 15 developed countries in Europe.
MSCI Japan Index designed to measure the performance of the large and mid cap segments of the Japanese market.
MSCI China Index captures large and mid cap representation across China A shares, H shares, B shares, Red chips, P chips and foreign listings (e.g. ADRs).
MSCI United Kingdom Index (USD) is designed to measure the performance of the large and mid cap segments of the UK market.
MSCI Canada Index is designed to measure the performance of the large and mid cap segments of the Canada market.
The MSCI USA Index is designed to measure the performance of the large and mid cap segments of the US market.
MSCI ACWI Index (Global Equities) is designed to represent performance of the full opportunity set of large- and mid-cap stocks across approximately 23 developed and approximately 25 emerging markets.
MSCI ACWI ex USA Index (Global ex US Equities) captures large and mid cap representation across approximately 22 of 23 developed markets (DM) countries (excluding the US) and approximately 25 emerging markets (EM) countries.
ICE BofA High Yield Index TR USD (High Yield) tracks the performance of US dollar denominated below investment grade rated corporate debt publicly issued in the US domestic market. Index constituents are capitalization-weighted based on their current amount outstanding times the market price plus accrued interest.
Bloomberg Capital US Treasury Index TR USD (Treasury Bonds) measures the performance of the US Treasury bond market.
Bloomberg US Aggregate Bond Index TR USD (Fixed Income Investment Grade) is an unmanaged index that covers the investment grade fixed rate bond market with index components for government and corporate securities, mortgage pass-through securities and asset-backed securities. The issues must be rated investment grade, be publicly traded and meet certain maturity and issue size requirements.
Bloomberg Capital 1–3 Month US Treasury Bill Index TR USD (Cash) includes all publicly issued zero-coupon US Treasury Bills with a remaining maturity between one and three months, are rated investment-grade and have an outstanding face value of $250 million or more.
In a rising interest rate environment, the value of fixed-income securities generally declines.
Stocks represent partial ownership of a corporation. If the corporation does well, its value increases, and investors share in the appreciation. However, if it goes bankrupt, or performs poorly, investors can lose their entire initial investment (i.e., the stock price can go to zero).
Bonds represent a loan made by an investor to a corporation or government. As such, the investor gets a guaranteed interest rate for a specific period of time and expects to get their original investment back at the end of that time period, along with the interest earned. Investment risk is repayment of the principal (amount invested). In the event of a bankruptcy or other corporate disruption, bonds are senior to stocks. Investors should be aware of these differences prior to investing.
High-yield securities (including junk bonds) are subject to greater risk of loss of principal and interest, including default risk, than higher-rated securities.
Dividends are not guaranteed and are subject to change or elimination.
Investment grade fixed income securities include broad fixed income, corporate securities, municipal bonds, treasuries, and mortgage backed securities (MBS). Investment grade securities are believed to be at less risk of default and rated higher by the credit rating agencies. In general, the bond market is volatile, and fixed income securities carry interest rate risk. (As interest rates rise, bond prices usually fall, and vice versa). This effect is usually more pronounced for longer-term securities. Fixed income securities also carry inflation risk, liquidity risk, call risk and credit and default risks for both issuers and counterparties. The municipal market can be affected by adverse tax, legislative, or political changes, and by the financial condition of the issuers of municipal securities. MBS are subject to prepayment and extension risk; as such, they react differently to changes in interest rates than other bonds. Small movements in interest rates may quickly and significantly reduce the value of certain MBS.
Treasuries are government debt securities issued by the US Government. Treasury securities typically pay less interest than other securities in exchange for lower default or credit risk. With relatively low yields, income produced by Treasuries may be lower than the rate of inflation.
US large cap equities include equities of companies with a market capitalization of over $10 billion. Although large cap equities are generally considered to be safer securities, large cap equities are still subject to the risks associated with stocks.
Global equities are equities that span across both developed countries and emerging markets. Investments in international and emerging markets securities include exposure to risks such as currency fluctuations, foreign taxes and regulations, and the potential for illiquid markets and political instability.
The energy sector is a category of stocks that relate to producing or supplying energy. The energy sector or industry includes companies involved in the exploration and development of oil or gas reserves, oil and gas drilling, and refining. The energy industry also includes integrated power utility companies such as renewable energy and coal.
Inflation is a gradual loss of purchasing power, reflected in a broad rise in prices for goods and services over time.
Investing in foreign companies poses additional risks since political and economic events unique to a country or region may affect those markets and their issuers. In addition to such general international risks, the portfolio may also be exposed to currency fluctuation risks and emerging markets risks as described further below.
Changes in the value of foreign currencies compared to the U.S. dollar may affect (positively or negatively) the value of the portfolio’s investments. Such currency movements may occur separately from, and/or in response to, events that do not otherwise affect the value of the security in the issuer’s home country. Also, the value of the portfolio may be influenced by currency exchange control regulations. The currencies of emerging market countries may experience significant declines against the U.S. dollar, and devaluation may occur subsequent to investments in these currencies by the portfolio.
Foreign investments, especially investments in emerging markets, can be riskier and more volatile than investments in the U.S. and are considered speculative and subject to heightened risks in addition to the general risks of investing in non-U.S. securities. Also, inflation and rapid fluctuations in inflation rates have had, and may continue to have, negative effects on the economies and securities markets of certain emerging market countries.
Small-, mid- and micro-cap companies may be hindered as a result of limited resources or less diverse products or services and have therefore historically been more volatile than the stocks of larger, more established companies.
RiverFront Investment Group, LLC (“RiverFront”), is a registered investment adviser with the Securities and Exchange Commission. Registration as an investment adviser does not imply any level of skill or expertise. Any discussion of specific securities is provided for informational purposes only and should not be deemed as investment advice or a recommendation to buy or sell any individual security mentioned. RiverFront is affiliated with Robert W. Baird & Co. Incorporated (“Baird”), member FINRA/SIPC, from its minority ownership interest in RiverFront. RiverFront is owned primarily by its employees through RiverFront Investment Holding Group, LLC, the holding company for RiverFront. Baird Financial Corporation (BFC) is a minority owner of RiverFront Investment Holding Group, LLC and therefore an indirect owner of RiverFront. BFC is the parent company of Robert W. Baird & Co. Incorporated, a registered broker/dealer and investment adviser.
To review other risks and more information about RiverFront, please visit the website at riverfrontig.com and the Form ADV, Part 2A. Copyright ©2025 RiverFront Investment Group. All Rights Reserved. 4876628

