

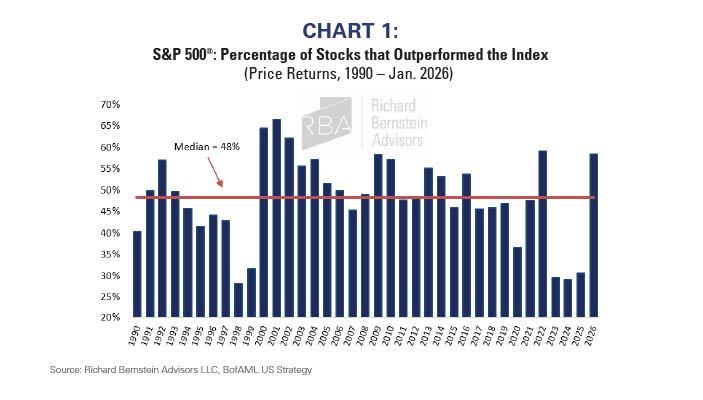
By the end of 2025, the US equity market was narrower for longer than during the Technology Bubble. One might think that an extreme market for such a long time might result in some strange valuations and interesting investment opportunities, and it indeed has.
Chart 1 shows the percentage of stocks within the S&P 500® that outperformed the market by year. The period from 2023 to 2025 was the longest stretch of narrow leadership in the chart’s history. Leadership has finally begun to broaden in 2026.
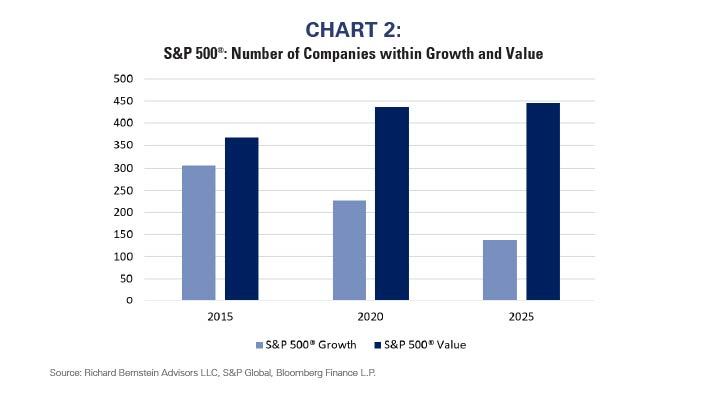
The extended period of narrow leadership has skewed the number of companies within the S&P 500® Growth and Value Indices. Chart 2 highlights that in 2015 roughly 300 S&P 500® companies were in the Growth Index (Note: companies can be in both indices so the combination of the Growth and Value indices will not sum to 500). By 2020, the number of growth companies had fallen to roughly 225. The narrow leadership of the past several years has led to under 140 companies in the current growth index.
On the other hand, nearly 450 of the S&P 500® companies are now included in the value index.
Historically narrow leadership means that about 90% of the S&P 500® companies now qualify as value stocks!
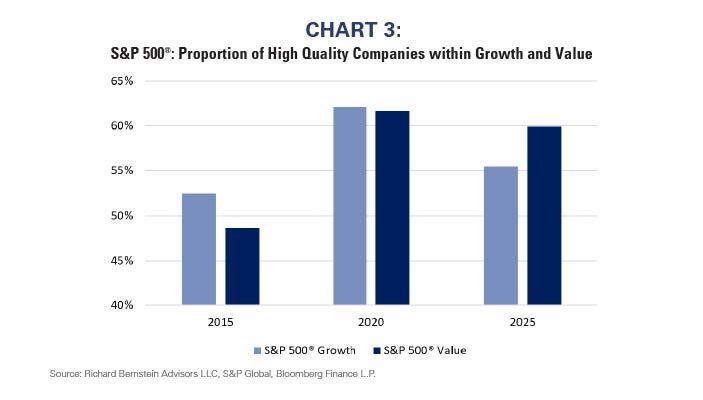
More high quality companies are now value
Normally, investing in the highest quality companies requires paying a premium valuation for those companies’ superior balance sheets and cash flows. However, as one might expect when 90% of the S&P 500® qualifies as value, many high quality US companies qualify as undervalued. No longer does one have to pay a premium price for superior balance sheets.
Chart 3 demonstrates that Growth contained a larger proportion of higher quality stocks than Value did in both 2015 and 2020, but today that has been reversed. About 60% of the Value universe is now comprised of higher quality companies.
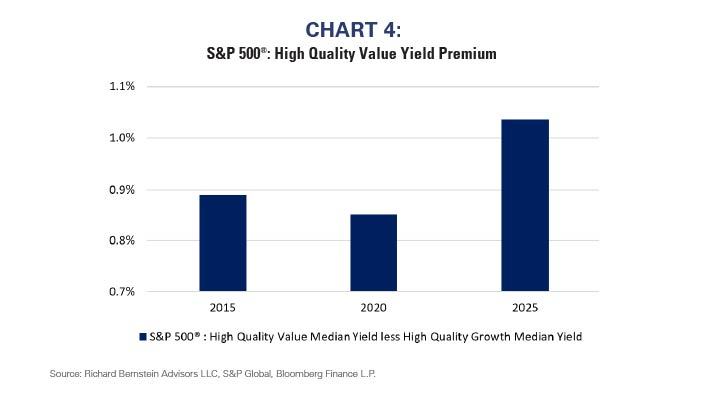
Quality = Yield
Financial theory says that companies must decide between paying out profits to shareholders as dividends or reinvesting cash flows back into their business through capital spending or share buybacks. As a result, investors prefer that slower growing companies pay dividends so investors can reinvest in other companies with superior growth opportunities.
This tends to result in a trade off between quality growth and dividend yield with the stocks of higher quality, faster growing companies tending to have lower dividend yields. The opportunity to invest in a high quality stock with above average dividend yield is not the norm.
Because of the historically long period of narrow leadership, investors today do not have to decide between quality and dividends! Chart 4 shows that high quality stocks in the value universe currently have a meaningfully higher dividend yield than high quality stocks in the growth universe. Although there is generally a yield premium for value-oriented, higher-quality stocks, the premium is currently higher than it has been over the past decade.
Shifting portfolios
RBA’s portfolios have been geared to the market broadening, and our shifts toward US quality, dividends, value, and non-US reflect some of the opportunities presented in these charts, and our general belief that profit fundamentals increasingly support a broadening of the global equity markets.
The historically narrow equity market clearly ignored the breadth of earnings data, which showed many more than seven growth stories in global equity markets. That narrowness became so extreme that quality now seems quite undervalued. The recent broadening of the global equity markets might be signaling that investors are starting to agree.
Authored by Richard Bernstein
Originally posted at Richard Bernstein Advisors on February 25.
INDEX DESCRIPTIONS: The following descriptions, while believed to be accurate, are in some cases abbreviated versions of more detailed or comprehensive definitions available from the sponsors or originators of the respective indices. Anyone interested in such further details is free to consult each such sponsor’s or originator’s website. The past performance of an index is not a guarantee of future results. Each index reflects an unmanaged universe of securities without any deduction for advisory fees or other expenses that would reduce actual returns, as well as the reinvestment of all income and dividends. An actual investment in the securities included in the index would require an investor to incur transaction costs, which would lower the performance results. Indices are not actively managed and investors cannot invest directly in the indices. Sectors: Sector references in this report are based on the S&P 500 sector constituents in accordance with the Global Industry Classification Standard (GICS®) developed by MSCI Barra and Standard & Poor’s. S&P 500®: The S&P 500® Index is an unmanaged, capitalization-weighted index designed to measure the performance of the broad US market. The index includes 500 leading companies covering approximately 80% of available market capitalization. S&P 500®Value: The S&P 500® Value Index measures constituents from the S&P 500 that are classified as value stocks based on three factors: the ratios of book value, earnings and sales to price. High Quality: We group the stocks according to their Standard and Poors’ Quality Ranking. High Quality defined as a Standard and Poor’s quality ranking of A+, A, A-, or B+. Low Quality: We group the stocks according to their Standard and Poors’ Quality Ranking. Low Quality defined as a Standard and Poor’s quality ranking of B, B-, C/D, or NR.

