

Naturally, in times of high inflation, the Federal Reserve’s actions dominate media coverage, especially leading up to interest rate decisions.
The federal funds rate rose from 0.25% in March 2022, to 5.5% in July of 2023, and stayed there for over a year. As of September 19, 2024, the Fed pivoted and lowered the rate to 5.00% . This “50 basis point” cut has sparked many debates among commentators.
Is this bullish or bearish? What happened last time? Stocks are at all-time highs, so how does that affect the narrative?
The potential narratives could go on, and people can argue endlessly over them. We prefer to look at the data and see if the Fed’s pivot is actionable, or just noise.
Popular narratives
Before reviewing the data to form our conclusion, let’s review the common narratives surrounding rate cuts, as generated by Claude.ai:
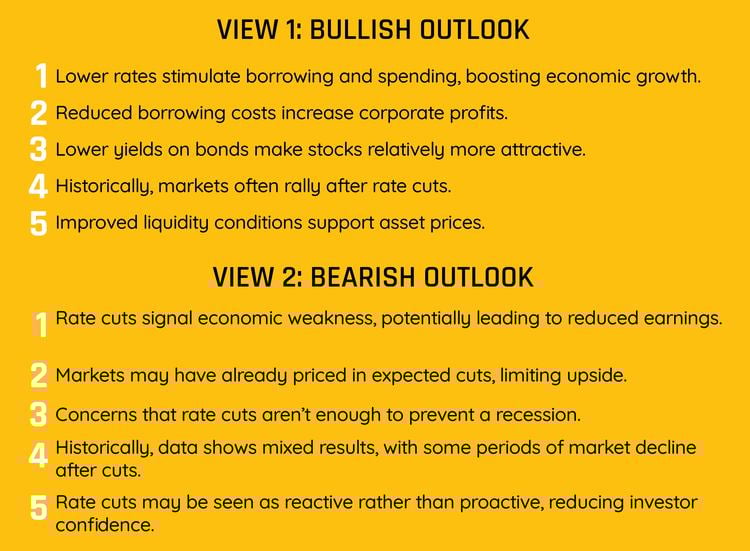
As this shows, there are many economic perspectives on what could happen. While having an opinion is not wrong, money managers ultimately put capital at risk, so a decision must be made. Is it bullish or bearish?
Let’s look at the numbers.
Cut Dates and Forward Returns
Before 1990, the Federal Reserve database doesn’t list exact historical rate cut dates. To ensure a repeatable process for the dates prior to 1990, we selected the cut date as the highest effective federal funds rate after a prior increase.
The table below shows each Fed cut date and the forward results for the S&P 500 Index (Price Return).
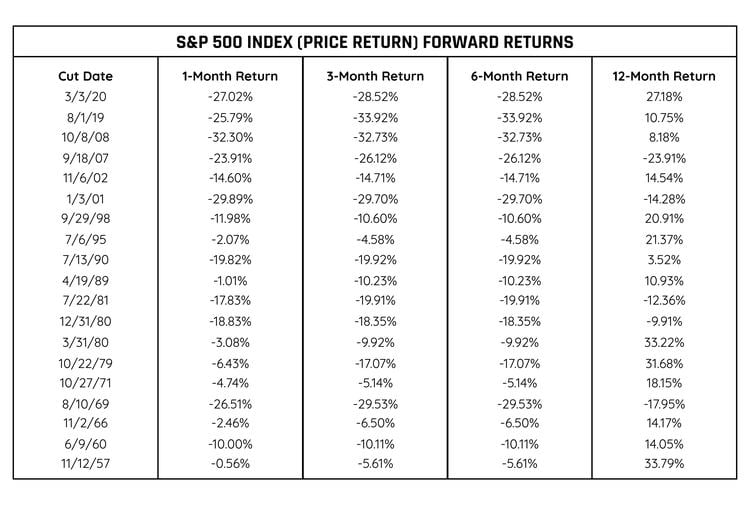
A first glance shows that over the next year, the S&P 500 Index (PR) generally performed well following the pivot. However, sometimes there were significant drawdowns along the way.
It’s important to note that a forward 12-month return on an asset that has historically drifted higher, like the S&P 500, will often show good results.
Cut Dates and Averages
A better approach is to compare the forward returns, after the Fed cut, to the average returns over any period in question. In other words, how did the S&P 500 Index (PR) do 12 months after the cut compared to how it has done in all 12-month periods?
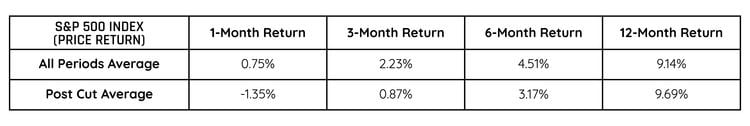
This data supports our initial observation: looking out one year from the Fed cut has produced an average return higher than the typical 12-month return. However, it also shows that the periods immediately after the cut have been more volatile than normal.
The Past Hasn’t Been Easy
To quantify the risk, we look at the Maximum Drawdown (MDD) and the Maximum Adverse Excursion (MAE) for the year following the cut date.
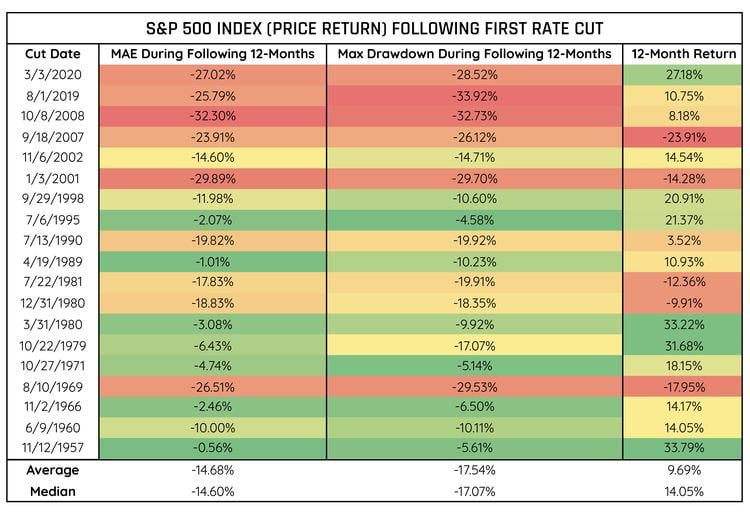
Maximum Adverse Excursion (MAE) shows us the largest amount by which the index was underwater from the signal date. Maximum Drawdown (MDD) tells us the maximum amount the index declined from its high-water mark during the period.
We Don’t Read into Narratives
Data can always be manipulated to support a particular opinion, so we aim to take an objective look and let the data inform our conclusions.
In this case, the Fed’s pivot has produced forward 12-month returns that are comparable to any period for the S&P 500 Index (PR). However, the path to get there has shown that, based on history, we should not be surprised to see significant volatility and drawdowns along the way.
By Tyler Lovingood
For more news, information, and analysis, visit the ETF Strategist Channel.
Disclaimer Information
Potomac Fund Management (“Company”) is an SEC-registered investment adviser. SEC registration does not constitute an endorsement of the advisory firm by the SEC nor does it indicate that the advisory firm has attained a particular level of skill or ability. This information is prepared for general information only and should not be considered as individual investment advice nor as a solicitation to buy or offer to sell any securities. This material does not constitute any representation as to the suitability or appropriateness of any investment advisory program or security. Please visit our FULL DISCLOSURE page. The company does not make any representations or warranties as to the accuracy, timeliness, suitability, completeness, or relevance of any information prepared by any unaffiliated third party, whether linked to the Company website or incorporated herein, and takes no responsibility for any of this information. The views of the Company are subject to change and the Company is under no obligation to notify you of any changes. Different types of investments involve varying degrees of risk, and there can be no assurance that the future performance of any specific investment or investment strategy will be profitable or equal to any historical performance level.
PFM-625-20240926

