

By Christ Konstantinos, CFA
SUMMARY
- The Fed has recommenced a rate cutting cycle, which is historically positive for stocks.
- US earnings revisions stay strong heading into the 4th quarter.
- Our balanced portfolios remain overweight US stocks, with preferences for mega-cap tech and financials.
We are excited to release our October 2025 Chart Pack, our visual quarterly designed to walk investors through what is happening in markets and why, what may come next, and how we are positioning RiverFront portfolios. In today’s Weekly View, we picked three Chart Pack visuals to highlight.
The quarter saw a renewed focus around central bank policy. The US Federal Reserve (Fed’) recommenced an interest rate cutting cycle that began in earnest a year ago before being paused (blue line, Chart 1 below). Signals coming from the fed funds futures market suggest that the Fed is not likely done cutting rates, implying roughly 100 basis points (i.e., 1%) more cuts by September 2026 (red line in Chart 1). Importantly, historical analysis suggests that rate cuts tend to be positive for US stock market returns (Chart 2, below).…especially if the economy doesn’t fall into recession within a year of the first cut.
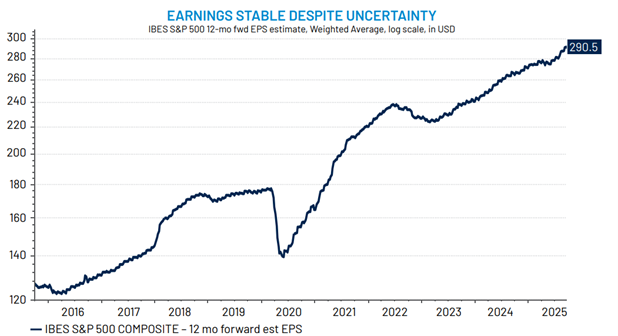
With monetary policy easing into an economy that shows little signs of recession, stocks could continue to show further upside from here. To this point, S&P 500 earnings revision momentum continues to accelerate (Chart 3, below), highlighting the resilience of American Economic Exceptionalism. RiverFront’s balanced portfolios remain overweight US stocks. We still favor high cash flow-generating tech companies, in the face of continued robust investment in artificial intelligence (‘AI’) and cloud computing. We also see attractive opportunities in financials. Both sectors offer more attractive opportunities in our opinion versus traditional ‘defensive’ plays such as consumer staples and utilities.
Chart 1: Market Pricing in More Rate Cuts Over the Next Year…
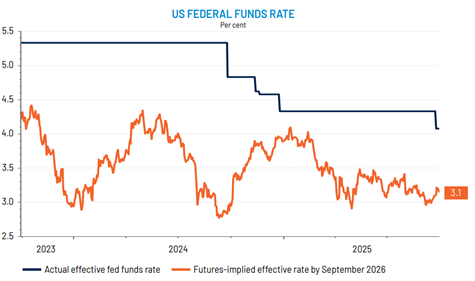
Chart 2: …Which Tend to Be Good for Stocks (Especially in the Absence of a Recession)
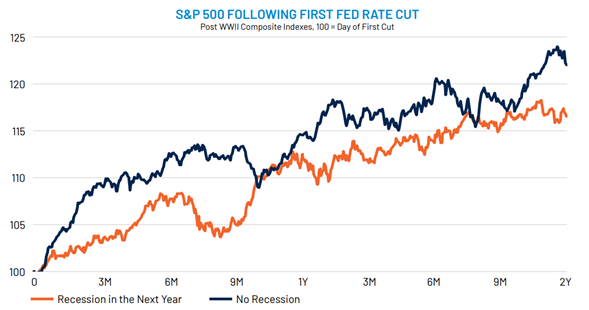
Chart 3: US Corporate Earnings Continue to Show Strong Momentum
Originally published by RiverFront Investment Group
For more news, information, and analysis, visit the ETF Strategist Content Hub.
Risk Discussion:
All investments in securities, including the strategies discussed above, include a risk of loss of principal (invested amount) and any profits that have not been realized. Markets fluctuate substantially over time, and have experienced increased volatility in recent years due to global and domestic economic events. Performance of any investment is not guaranteed. In a rising interest rate environment, the value of fixed-income securities generally declines. Diversification does not guarantee a profit or protect against a loss. Investments in international and emerging markets securities include exposure to risks such as currency fluctuations, foreign taxes and regulations, and the potential for illiquid markets and political instability. Please see the end of this publication for more disclosures.
Important Disclosure Information:
The comments above refer generally to financial markets and not RiverFront portfolios or any related performance. Opinions expressed are current as of the date shown and are subject to change. Past performance is not indicative of future results and diversification does not ensure a profit or protect against loss. All investments carry some level of risk, including loss of principal. An investment cannot be made directly in an index.
Information or data shown or used in this material was received from sources believed to be reliable, but accuracy is not guaranteed.
This report does not provide recipients with information or advice that is sufficient on which to base an investment decision. This report does not take into account the specific investment objectives, financial situation or need of any particular client and may not be suitable for all types of investors. Recipients should consider the contents of this report as a single factor in making an investment decision. Additional fundamental and other analyses would be required to make an investment decision about any individual security identified in this report.
Chartered Financial Analyst is a professional designation given by the CFA Institute (formerly AIMR) that measures the competence and integrity of financial analysts. Candidates are required to pass three levels of exams covering areas such as accounting, economics, ethics, money management and security analysis. Four years of investment/financial career experience are required before one can become a CFA charterholder. Enrollees in the program must hold a bachelor’s degree.
All charts shown for illustrative purposes only. Technical analysis is based on the study of historical price movements and past trend patterns. There are no assurances that movements or trends can or will be duplicated in the future.
Stocks represent partial ownership of a corporation. If the corporation does well, its value increases, and investors share in the appreciation. However, if it goes bankrupt, or performs poorly, investors can lose their entire initial investment (i.e., the stock price can go to zero). Bonds represent a loan made by an investor to a corporation or government. As such, the investor gets a guaranteed interest rate for a specific period of time and expects to get their original investment back at the end of that time period, along with the interest earned. Investment risk is repayment of the principal (amount invested). In the event of a bankruptcy or other corporate disruption, bonds are senior to stocks. Investors should be aware of these differences prior to investing.
In general, the bond market is volatile, and fixed income securities carry interest rate risk. (As interest rates rise, bond prices usually fall, and vice versa). This effect is usually more pronounced for longer-term securities). Fixed income securities also carry inflation risk, liquidity risk, call risk and credit and default risks for both issuers and counterparties. Lower-quality fixed income securities involve greater risk of default or price changes due to potential changes in the credit quality of the issuer. Foreign investments involve greater risks than U.S. investments, and can decline significantly in response to adverse issuer, political, regulatory, market, and economic risks. Any fixed-income security sold or redeemed prior to maturity may be subject to loss.
Technology and internet-related stocks, especially of smaller, less-seasoned companies, tend to be more volatile than the overall market
Artificial intelligence, or AI, refers to the simulation of human intelligence by software-coded heuristics. Nowadays this code is prevalent in everything from cloud based, enterprise applications to consumer apps and even embedded firmware
Ned Davis Research (NDR) is a global provider of independent investment research, solutions and tools. Founded in 1980, NDR helps clients around the world make objective investment decisions.
Index Definitions:
Standard & Poor’s (S&P) 500 Index measures the performance of 500 large cap stocks, which together represent about 80% of the total US equities market.
IBES MSCI USA Information Technology Sector is The MSCI USA Information Technology Index is designed to capture the large and mid cap segments of the US equity universe. All securities in the index are classified in the Information Technology sector as per the Global Industry Classification Standard (GICS®).
Definitions:
Basis point (bps)= 1/100th of a percent
The Institutional Brokers’ Estimate System (IBES) is a database used by brokers and active investors to access the estimates made by stock analysts regarding the future earnings of publicly traded American companies.
Forward price-to-earnings is a version of the ratio of price-to-earnings (P/E) that uses forecasted earnings for the P/E calculation. Forward price-to-earnings ratio is calculated by dividing the current price by the estimated future earnings per share to estimate a company’s profitability.
Earnings per share (EPS) is calculated as a company’s profit divided by the outstanding shares of its common stock. The resulting number serves as an indicator of a company’s profitability.
A recession is a significant, widespread, and prolonged downturn in economic activity. A common rule of thumb is that two consecutive quarters of negative gross domestic product (GDP) growth indicate a recession. However, more complex formulas are also used to determine recessions.
When referring to being “overweight” or “underweight” relative to a market or asset class, RiverFront is referring to our current portfolios’ weightings compared to the composite benchmarks for each portfolio. Asset class weighting discussion refers to our Advantage portfolios.
RiverFront Investment Group, LLC (“RiverFront”), is a registered investment adviser with the Securities and Exchange Commission. Registration as an investment adviser does not imply any level of skill or expertise. Any discussion of specific securities is provided for informational purposes only and should not be deemed as investment advice or a recommendation to buy or sell any individual security mentioned. RiverFront is affiliated with Robert W. Baird & Co. Incorporated (“Baird”), member FINRA/SIPC, from its minority ownership interest in RiverFront. RiverFront is owned primarily by its employees through RiverFront Investment Holding Group, LLC, the holding company for RiverFront. Baird Financial Corporation (BFC) is a minority owner of RiverFront Investment Holding Group, LLC and therefore an indirect owner of RiverFront. BFC is the parent company of Robert W. Baird & Co. Incorporated, a registered broker/dealer and investment adviser.
To review other risks and more information about RiverFront, please visit the website at riverfrontig.com and the Form ADV, Part 2A. Copyright ©2025 RiverFront Investment Group. All Rights Reserved. ID 4444462

