

The U.S. economy grew at a surprisingly strong annualized rate of 3.0% in the second quarter of 2025, which far outpaced the post-2000 average of 2.3% and easily beat expectations. At first glance, this might suggest a booming economy. Yet, jobs creation tells a vastly different story where employment growth has stalled by falling well below the average since January 2000 of 284,000 jobs per month. How can we reconcile this stark divergence between headline GDP and the labor market?
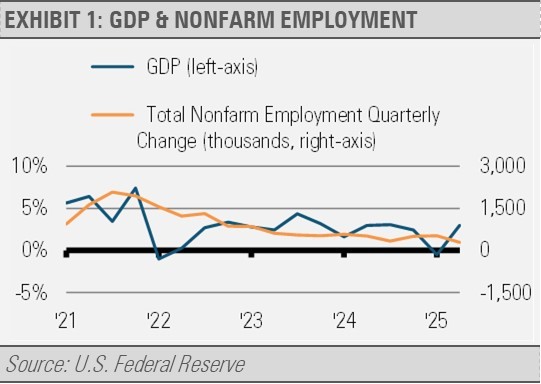
To start, it’s important to understand what makes up GDP and employment data. While related over the long term, they can diverge in shorter periods due to the way they are measured and the forces that drive them. The second quarter GDP surge, for example, was not driven by domestic economic strength, but rather a sharp decline in imports. With imports plunging 30.3%, largely due to changing tariff policies, net exports added nearly 5% to GDP.
This second quarter decline in imports was largely set up by the first quarter’s jump in imports as businesses built inventory ahead of the expected tariffs.
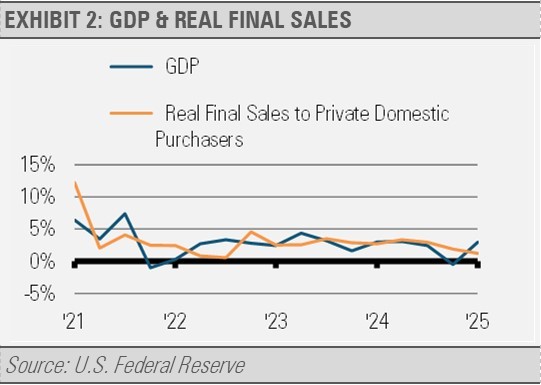
When we take a step back and average trends over time, a clearer image emerges. The first-to-second quarter swing in GDP is a textbook example of how trade and inventory shifts can skew near-term numbers. Real final sales, consumer demand, and business investment all suggest the economy is growing modestly and persistently.
To gain an even clearer picture of the true growth of the economy, we prefer to look at real final sales to private domestic purchasers, which excludes the wild swings in net exports and changes in inventories. For example, rather than contracting 0.5% as GDP did in the first quarter, final sales increased at a 1.5% annualized rate. Furthermore, the 1.2% annualized growth in final sales during the second quarter reflects more accurately the slowing but persistent pace of economic growth in our view.
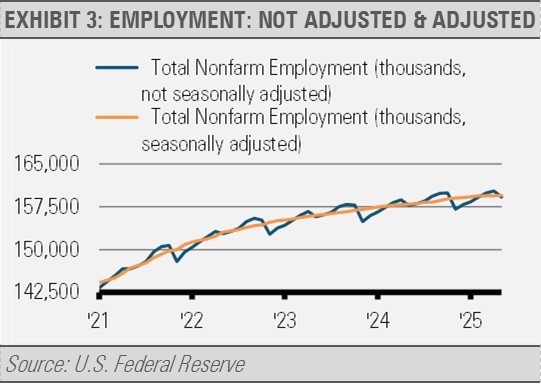
Meanwhile, labor market weakness may appear equally perplexing, but is partially explained by the flaws and lags in the data. Monthly employment figures are derived from surveys conducted during a single week of each month and then seasonally adjusted. These response rates to these surveys have declined over time, and major revisions can significantly alter today’s picture.
As the graph below illustrates, the seasonal adjustments alone can have significant impacts on the data. Still, these adjustments work out over time with the adjusted and non-adjusted data eventually converging after shorter-term differences.
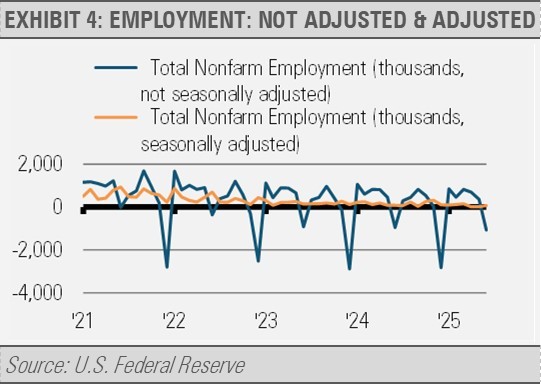
Over shorter periods, seasonal patterns, such as summer school closings or retail employment cycles, can further skew these readings as we can see in the monthly comparison of seasonally adjusted and non-adjusted monthly jobs creation data below.
The employment reports are based on a motley set of data and the GDP numbers can be heavily swayed by temporary factors that may obscure the actual health of the economy. This is why we should not put too much weight on any single data point but take a broader view by looking at average changes over time as well as looking at the underlying data, such as real final sales in addition to GDP. By doing so, we can create a clearer picture of the state of the economy by which we can make better investment decisions.
Zooming out further, long-term economic growth is driven by two forces: labor force growth and productivity growth. Right now, labor force expansion is slowing. Demographic trends, such as retiring Baby Boomers, declining birth rates, and lower immigration, are constraining the supply of new workers. These structural shifts are long-lasting and likely to persist for years.
However, there is a potential counterbalance in productivity. The widespread adoption of artificial intelligence (AI) could usher in a new productivity boom, much like the one seen during the 1990s information revolution. Then, a declining labor force growth rate was offset by faster productivity growth, which allowed GDP growth to remain strong. If AI delivers similar productivity gains, it could help maintain or even accelerate economic output per worker despite a shrinking workforce.
INVESTMENT IMPLICATIONS
This environment of uneven near-term data but promising long-term trends has direct implications for investors. Corporate revenue and earnings ultimately follow GDP growth, and even at a slower pace, rising output can drive household income and consumption, the largest component of the economy.
Given today’s mixed signals, we continue to favor high-quality U.S. companies with consistent earnings and low financial leverage. Our overweight positions remain in financial services, information technology, and consumer staples. On the fixed income side, we prefer asset-backed and mortgage-backed securities, along with corporate bond ETFs in the belly of the yield curve. To diversify further, we have added a merger-arbitrage ETF to our alternative allocation, which offers the potential for capital appreciation with a low correlation to traditional assets.
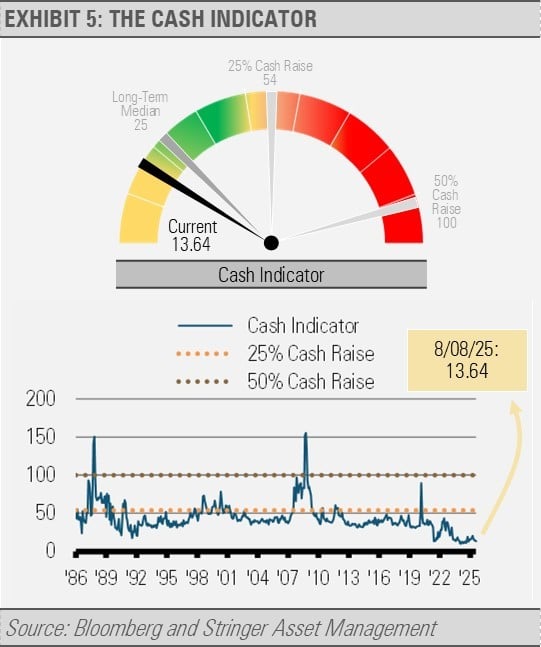
THE CASH INDICATOR
After bouncing off very low levels and jumping with April’s tariff-related uncertainty, the Cash Indicator (CI) has once again fallen to historically low levels. As we have cautioned previously, when financial markets reflect this much complacency, they can easily be disrupted by a negative surprise. Still, with the backdrop of persistent economic growth likely propelling corporate earnings and household incomes higher, we see equity market declines as buying opportunities.
For more news, information, and analysis, visit the ETF Strategist Content Hub.
DISCLOSURES
Any forecasts, figures, opinions or investment techniques and strategies explained are Stringer Asset Management, LLC’s as of the date of publication. They are considered to be accurate at the time of writing, but no warranty of accuracy is given and no liability in respect to error or omission is accepted. They are subject to change without reference or notification. The views contained herein are not to be taken as advice or a recommendation to buy or sell any investment and the material should not be relied upon as containing sufficient information to support an investment decision. It should be noted that the value of investments and the income from them may fluctuate in accordance with market conditions and taxation agreements and investors may not get back the full amount invested.
Past performance and yield may not be a reliable guide to future performance. Current performance may be higher or lower than the performance quoted.
The securities identified and described may not represent all of the securities purchased, sold or recommended for client accounts. The reader should not assume that an investment in the securities identified was or will be profitable.
Data is provided by various sources and prepared by Stringer Asset Management, LLC and has not been verified or audited by an independent accountant.

