

This week’s market commentary will focus on market breadth, the weakness of some technology stocks, and our Chart of the Week: Gold.
Market Breadth
Most of last year’s gains were made by a few of the market’s largest names. Those were the same stocks that were some of the worst performers in 2022. Now, in 2024, we are beginning to see broader market participation. Recently, the Advance-Decline Line of the S&P 1500 index, which measures the number of stocks increasing versus decreasing, broke out to a new high. This is a measure of market breadth. It is better to see a rising tide lifting all ships, as opposed to just a few large stocks.
With broader market participation, some of the largest technology and previously strongest stocks have begun to show relative weakness. At least three of the Magnificent 7 stocks are beginning to slip and show weakening relative strength to the broader market indexes. This is something to keep an eye on, given the heavy impact that technology stocks have on the market’s movements.
Now that the market breadth is improving, we are beginning to see some of the previously weaker mid and small cap stocks show early signs of strength. In addition, some strength in stocks is coming from sectors outside of technology-related sectors. Stocks like Procter and Gamble have been featured in previous market commentaries. Additionally, we continue to keep a close eye on the Energy sector, as it attempts to break out some resistance.
Chart of the Weak-Gold
Let’s turn our attention away from the equity markets. This week’s chart of the week is Gold. To analyze gold’s technicals, we will be looking at a gold ETF, GLDM.
When it shows positive characteristics, gold can often be a “diversifier” within a portfolio. Contrary to popular belief, correlations of securities will change over time. There is an assumption in markets that gold and bonds move opposite of each other. However, there will be periods when gold experiences positive, negative, or no correlation to bond securities and equities.
Looking at weekly data for the last six months, Gold has had mainly positive correlation to both stocks and bonds, while showing a few positive technical characteristics. Refer to the chart and numbered points below.
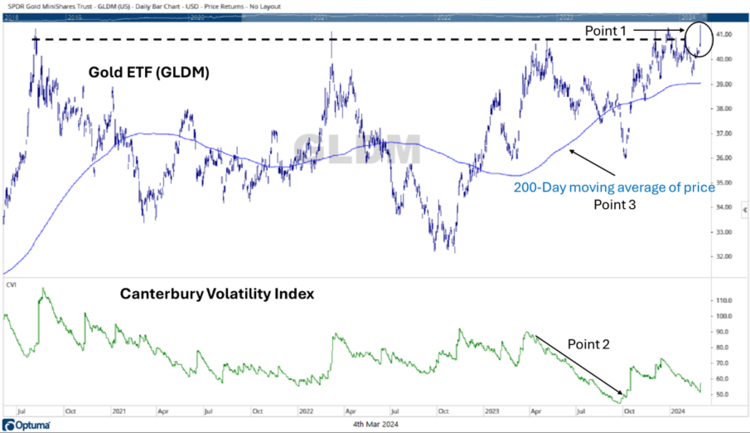
- This Gold ETF recently set a new all-time high. After a large sideways trend that has occurred for the last few years, GLDM matched its old high in December. After a small consolidation, GLDM broke out to a new all-time high on Friday and continued the move into Monday.
- During a decline that occurred from April to October 2023, the volatility of Gold (as measured by the Canterbury Volatility Index) also declined. This is uncommon during a decline in price. Since then, Gold has rallied and seen some large upward moves. Now, volatility is once again declining as the ETF sets a new high.
- The blue line is Gold’s 200-day moving average of price. As Gold moved sideways, this line also fluctuated sideways. Now, as gold has set a new high, this line has seen a steady uptrend. Moving averages indicate long-term trends.
Bottom Line
One positive point is that we are beginning to see broader participation in the markets, but on the other hand, it is concerning that technology stocks are no longer leading. While several tech stocks continue to look strong, some are showing signs of weakness. Given the market’s heavy skew towards technology stocks, if technology stocks begin to fall off, that could pose some issues for the markets.
That being said, portfolio management is about maintaining stability. It would not be efficient to have a portfolio of 500 stocks but put a quarter of your money into just seven of them. That is what the S&P 500 has done. More stocks rising creates opportunities to identify securities with the supply and demand characteristics of stocks that want to go up. Our team at Canterbury continues to do that, and has taken recent positions in Procter and Gamble, Dover Corporation, and Gold.
As markets fluctuate, the risk characteristics will also change. As those characteristics shift, it is important that your investment portfolio remains adaptive. An Adaptive portfolio is capable of moving in concert with everchanging market environments- bull or bear.
For more news, information, and analysis, visit the ETF Strategist Channel.

