

This week’s Market Update will focus on sector rankings, the S&P 500’s weightings, and as always, portfolio management.
The S&P 500 is divided into 11 separate sectors or categories. Stocks within each sector generally tend to be correlated to one another. Using Canterbury’s technical ranking system, which accounts for both a security’s performance and risk (as defined by volatility), here is how each sector currently ranks on a risk-adjusted basis:
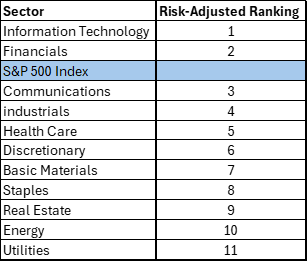
While the S&P 500 is divided into 11 sectors, not all sectors are created equal. For instance, the Information Technology sector represents 29.5% of the index’s market capitalization. That is larger than Industrials, Staples, Energy, Real Estate, Basic Materials, and Utilities combined.
This is the exact reason why the S&P 500 index, which is the combination of all those listed sectors, can be ranked 3rd on this list. If the index was equally weighted across the sectors, it would fall into the middle of the rankings, but it’s not equally weighted. In other words, the S&P 500 is heavily skewed towards technology-related stocks. When technology stocks do well, the S&P 500 index will do well. When technology stocks falter, so will the S&P 500.
By now, I am sure you have heard of the “Magnificent 7.”. The Mag 7 refers to the largest technology-related stocks: Microsoft, Apple, Nvidia, Amazon, Google, Meta, and Tesla. Collectively, these seven stocks make up 28.8% percent of the S&P 500’s market capitalization. Let me ask you this, when building a portfolio of securities, is it logical to put 30% of your money in 7 stocks, and then divide the rest into 493 stocks? Logic (and risk management) would say no.
While the S&P 500’s current make-up has allowed the index to perform well, it also puts the index in a risky situation. It relies heavily on just a few components. If those components begin to show signs of weakness, it probably wouldn’t bode well for the market index.
Charts of the Week- Procter & Gamble
Let’s shift our focus away from technology stocks and focus on stocks in other sectors. One stock that Canterbury is keeping a close eye on comes from the Discretionary sector. Consumer Discretionary heavily favors its two largest stocks: Amazon and Tesla. Amazon has done well recently; Tesla has struggled.
The stock we are looking at this week is Procter & Gamble. This is not the most “exciting” name stock, but it is a stock that is starting to show some positive technical characteristics. Refer to the chart and bulleted points below.
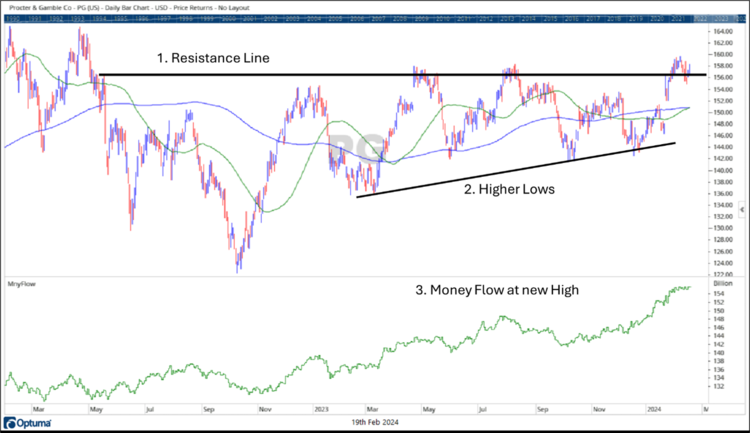
- Procter and Gambel stock (PG) is attempting to break above overhead resistance. This resistance occurs at an intersection at some of its prior peaks. In the last few weeks, PG broke above resistance and is now retesting this line for new support.
- While the stock has a horizontal overhead line of resistance, its line of support is ascending. It has put in a series of higher lows. This is a positive trend.
- One thing to look for with liquid traded securities is the strength of volume. Ideally, you want volume to be stronger when the stock is going up than when it is going down. The Money Flow index is a volume indicator that measures “smart money.” While the price of PG is at relatively the same place as it was several months ago, Money Flow is at a new high, indicating that the volume has been stronger on the upside.
- Not shown in the chart, but PG currently has a Canterbury Volatility Index reading of CVI 79. This puts it in the 5th percentile of lowest volatility levels for S&P 500 stocks. This means that PG’s recent fluctuations have been less erratic/volatile than other stocks.
Bottom Line
The market’s largest sectors are leading the way right now. Typically, when technology stocks lead, it indicates that investors as a whole are willing to accept more perceived “risk.”
On the other hand, many technology stocks look extended. In other words, they have gone up in a short amount of time with little correction. These same stocks were the ones that experienced -50% plus declines in 2022. That does give some cause for concern as it pertains to the market’s strength moving forward. Nonetheless, technology remains strong for the time being.
One thing that our portfolio strategy, the Canterbury Portfolio Thermostat, looks to accomplish is to maintain low portfolio volatility. This involves holding securities that have low correlation and move differently from each other. Managing risk is critical to long-term investment success.
At the same time, we continue to identify potential opportunities within a basket of stocks and ETFs that have positive trend characteristics. We build watchlists of several stocks with these characteristics and look to implement some of them into our portfolio. Procter and Gamble is one of those stocks that we are currently keeping a close eye on.
Keep in mind that trends do not stay in place forever. Sometimes a security’s characteristics will change, from positive to negative or negative to positive. In those cases, an investment portfolio should adapt and adjust its holdings to move in concert with ever-changing market conditions.
For more news, information, and analysis, visit the ETF Strategist Channel.

