

The questions in our inbox have gotten louder lately. Are we reliving 1999? Has the tech rally reached the dangerous ‘Euphoria’ bubble stage we first discussed in our 2026 Outlook? And is the recent surge in initial public offerings (IPOs)— led by SpaceX on Friday— diluting existing holders just as valuations were already drawing scrutiny?
We understand the concern. With the Iran war keeping energy prices elevated and interest rates stubbornly high, this is not a risk-free environment for growth assets…as the recent volatility in the Nasdaq demonstrates. But despite those potential headwinds, we remain overweight US technology in our portfolios. Here’s why.
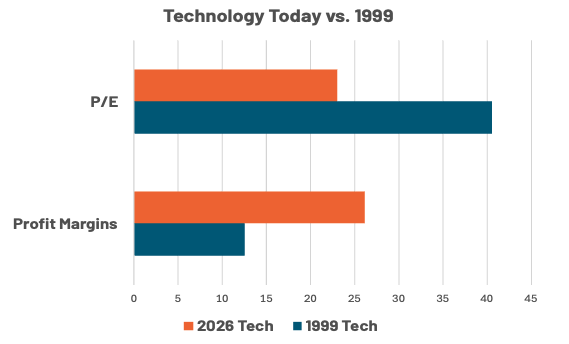
This Isn't 1999 — At Least Not Yet, According to Valuation
In the late 1990s, technology stocks were priced for perfection, on top of fundamentals that were anything but perfect. Today, the picture looks materially different to us on two key dimensions: valuation and earnings quality. Chart 1 below tells the story clearly: the MSCI USA Information Technology Index currently trades around 23x forward earnings, versus 40x at the peak of the dot-com bubble. This current valuation represents only a ~10% valuation premium to the S&P 500, despite much stronger revenue and earnings growth for tech. Critically, profit margins have moved in the opposite direction — over 26% today versus 13% in 1999. You’re paying a lot less in 2026 for better businesses.
Yes, tech valuations are sensitive to rising interest rates — higher rates compress the multiples warranted for long-duration growth assets, all else remaining equal. If the Iran conflict continues driving energy-related inflation and forces rates higher still, valuation headwinds are real. We’re watching this closely. But last week’s softer-than-expected core CPI print — which suggests underlying inflation ex-energy may be better behaved than feared — provides some reassurance that the rate picture isn’t uniformly bleak. Given the soft unit labor costs discussed in last week’s Weekly View, we believe that the core inflation story is more moderate than feared.
The #1 'Tell' for When to Leave the Party is Cash Flow— No Warning Signal Here Yet, In Our View
If valuation is the warning light on the dashboard, free cash flow is the engine itself. In our view, the single most important early warning signal for when an equity bubble may burst is the divergence between reported earnings before interest and taxes (EBIT) and free cash flow — when reported profits race well ahead of actual cash generation, it’s a sign that hype is outrunning fundamentals.
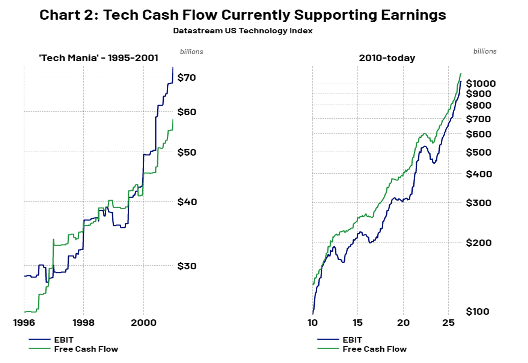
Look at the left panel of the cash flow chart (Chart 2, right). Towards the end of the 1995–2001 ‘Tech Mania’ phase, EBIT (blue line) continued to climb sharply while free cash flow (green line) lagged — the classic signature of deteriorating earnings quality. Now look at the right panel: today, free cash flow is running above EBIT across the US technology sector — approaching $1 trillion on an annualized basis, x times 2000’s tally — and continues to do so consistently. That is the opposite of a bubble signal. It tells us that tech’s reported earnings are being validated by actual cash coming in the door. Until that relationship inverts, we believe the fundamentals support staying invested in mega-cap, high cash flow tech shares.
On the IPO Supply Question: We Believe US Indices Can Handle It
A word on the equity supply concern: we’re less worried than some. The US equity market is the deepest, most liquid stock market in the world; we expect it to be able to absorb supply shocks without structural damage. With $77 trillion in the broad Russell 3000 and $65T in the more widely followed S&P 500, SpaceX’s expected $75B issuance represents a small fraction of the market’s capitalization… especially when considering ~$8T of liquidity sitting in money markets. And while IPO issuance is heating up, from a historical perspective it is less extreme – roughly 100 expected IPOs this year compares to 250 in 2021 and 400 in 1999, according to Goldman Sachs. Furthermore, Goldman expects buybacks and M&A to more than offset new equity supply in the US this year.
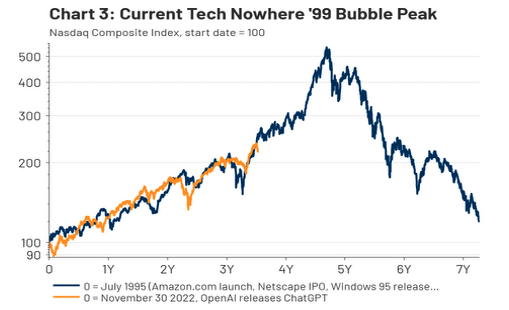
The Nasdaq overlay chart below is instructive — if history rhymes, the current AI-era tech bull market (orange line) may still have significant runway ahead before reaching a 1999-style apex (blue line). But “significant runway” doesn’t mean “straight up.” Regular pullbacks — like the -5% drawdown day in the Nasdaq on June 5— are healthy. They bleed off excessive optimism before it becomes euphoria. Instead of the price chart, watch the cash flow chart. The day free cash flow begins to meaningfully trail EBIT across the technology sector — the way it did in 1999 and 2000 — is the day to start considering underweight tech. That signal will matter more to us than any individual valuation multiple or macro headline. But for now, that signal is not flashing. The party continues — and we intend to stay for a while.
Risk Discussion: All investments in securities, including the strategies discussed above, include a risk of loss of principal (invested amount) and any profits that have not been realized. Markets fluctuate substantially over time, and have experienced increased volatility in recent years due to global and domestic economic events. Performance of any investment is not guaranteed. In a rising interest rate environment, the value of fixed-income securities generally declines. Diversification does not guarantee a profit or protect against a loss. Investments in international and emerging markets securities include exposure to risks such as currency fluctuations, foreign taxes and regulations, and the potential for illiquid markets and political instability. Please see the end of this publication for more disclosures.
Authored by Chris Konstantinos
For more news, information, and analysis, visit the ETF Strategist Content Hub.
Important Disclosure Information
The comments above refer generally to financial markets and not RiverFront portfolios or any related performance. Opinions expressed are current as of the date shown and are subject to change. Past performance is not indicative of future results and diversification does not ensure a profit or protect against loss. All investments carry some level of risk, including loss of principal. An investment cannot be made directly in an index.
Information or data shown or used in this material was received from sources believed to be reliable, but accuracy is not guaranteed.
This report does not provide recipients with information or advice that is sufficient on which to base an investment decision. This report does not take into account the specific investment objectives, financial situation or need of any particular client and may not be suitable for all types of investors. Recipients should consider the contents of this report as a single factor in making an investment decision. Additional fundamental and other analyses would be required to make an investment decision about any individual security identified in this report.
Chartered Financial Analyst is a professional designation given by the CFA Institute (formerly AIMR) that measures the competence and integrity of financial analysts. Candidates are required to pass three levels of exams covering areas such as accounting, economics, ethics, money management and security analysis. Four years of investment/financial career experience are required before one can become a CFA charterholder. Enrollees in the program must hold a bachelor’s degree.
All charts shown for illustrative purposes only. Technical analysis is based on the study of historical price movements and past trend patterns. There are no assurances that movements or trends can or will be duplicated in the future.
Stocks represent partial ownership of a corporation. If the corporation does well, its value increases, and investors share in the appreciation. However, if it goes bankrupt, or performs poorly, investors can lose their entire initial investment (i.e., the stock price can go to zero). Bonds represent a loan made by an investor to a corporation or government. As such, the investor gets a guaranteed interest rate for a specific period of time and expects to get their original investment back at the end of that time period, along with the interest earned. Investment risk is repayment of the principal (amount invested). In the event of a bankruptcy or other corporate disruption, bonds are senior to stocks. Investors should be aware of these differences prior to investing.
In general, the bond market is volatile, and fixed income securities carry interest rate risk. (As interest rates rise, bond prices usually fall, and vice versa). This effect is usually more pronounced for longer-term securities). Fixed income securities also carry inflation risk, liquidity risk, call risk and credit and default risks for both issuers and counterparties. Lower-quality fixed income securities involve greater risk of default or price changes due to potential changes in the credit quality of the issuer. Foreign investments involve greater risks than U.S. investments, and can decline significantly in response to adverse issuer, political, regulatory, market, and economic risks. Any fixed-income security sold or redeemed prior to maturity may be subject to loss.
Technology and Internet-related stocks, especially of smaller, less-seasoned companies, tend to be more volatile than the overall market.
Artificial intelligence, or AI, refers to the simulation of human intelligence by software-coded heuristics. Nowadays this code is prevalent in everything from cloudbased, enterprise applications to consumer apps and even embedded firmware.
Index Definitions:
Standard & Poor’s (S&P) 500 Index measures the performance of 500 large cap stocks, which together represent about 80% of the total US equities market.
The Institutional Brokers’ Estimate System (IBES) is a database used by brokers and active investors to access the estimates made by stock analysts regarding the future earnings of publicly traded American companies.
The MSCI USA Information Technology Index is designed to capture the large and mid cap segments of the US equity universe. All securities in the index are classified in the Information Technology sector as per the Global Industry Classification Standard (GICS®).
The Russell 3000 Index is a market-capitalization-weighted index tracking the 3,000 largest publicly traded U.S. companies, representing approximately 98% of the investable U.S. equity market.
Definitions:
Earnings before interest and taxes (EBIT) is a company’s operating profit without interest expenses and income taxes.
The term cash flow refers to the net amount of cash and cash equivalents being transferred in and out of a company. Cash received represents inflows, while money spent represents outflows.
Price-Earnings Ratio (P/E Ratio) is the ratio for valuing a company that measures its current share price relative to its per-share earnings.
Inflation is a gradual loss of purchasing power, reflected in a broad rise in prices for goods and services over time.
When referring to being “overweight” or “underweight” relative to a market or asset class, RiverFront is referring to our current portfolios’ weightings compared to the composite benchmarks for each portfolio. Asset class weighting discussion refers to our Advantage portfolios.
Mega cap is a designation for the largest companies in the investment universe as measured by market capitalization. While the exact thresholds change with market conditions, mega cap generally refers to companies with a market capitalization above $200 billion.
RiverFront Investment Group, LLC (“RiverFront”), is a registered investment adviser with the Securities and Exchange Commission. Registration as an investment adviser does not imply any level of skill or expertise. Any discussion of specific securities is provided for informational purposes only and should not be deemed as investment advice or a recommendation to buy or sell any individual security mentioned. RiverFront is affiliated with Robert W. Baird & Co. Incorporated (“Baird”), member FINRA/SIPC, from its minority ownership interest in RiverFront. RiverFront is owned primarily by its employees through RiverFront Investment Holding Group, LLC, the holding company for RiverFront. Baird Financial Corporation (BFC) is a minority owner of RiverFront Investment Holding Group, LLC and therefore an indirect owner of RiverFront. BFC is the parent company of Robert W. Baird & Co. Incorporated, a registered broker/dealer and investment adviser.
To review other risks and more information about RiverFront, please visit the website at riverfrontig.com and the Form ADV, Part 2A. Copyright ©2026 RiverFront Investment Group. All Rights Reserved. [ID 5579020]

