

The Fairlead Tactical Sector ETF (TACK) is a model-driven exchange-traded fund utilizing a disciplined methodology designed to navigate all market environments. The fund seeks capital appreciation with limited drawdowns. The basis of TACK’s model is technical analysis, with an emphasis on indicators designed to identify long-term trends and major reversals. The primary goal of the strategy is to leverage sector leadership, while navigating equity market downdrafts through asset allocation. Opportunities are identified using signals from a combination of technical indicators designed to identify price trends, after which a quantitative momentum overlay is applied to finalize TACK’s portfolio.
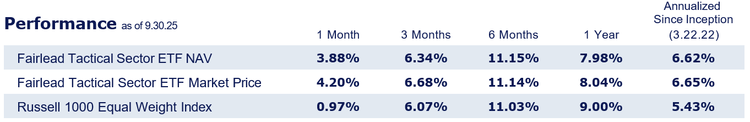
TACK gained 4.20% in September on a total return basis, resulting in meaningful outperformance relative to its benchmark, the Russell 1000 Equal Weight Index, which returned 0.97% over the same period, and the SPDR S&P 500 ETF (SPY), which returned 3.56%. The 2025 YTD return is 10.76%, ahead of the benchmark return of 9.31%.
TACK holdings that contributed to outperformance for the month were the SPDR® Gold MiniShares Trust (GLDM), the Technology Sector SPDR® XLK), the Communication Services Sector SPDR® (XLC), the Utilities Sector SPDR® (XLU), and the Consumer Discretionary Sector SPDR® (XLY).
For Q3, TACK returned 6.68% versus 6.07% for the Russell 1000 Equal Weight Index. TACK’s outperformance in September was driven not only by its exposure to outperforming ETFs like GLDM and XLK, but also its lack of exposure to the three worst performing sectors of the month, including the Consumer Staples Sector SPDR® ETF (XLP), which TACK removed at the beginning of August. The other two underperformers were the Energy Sector SPDR® ETF (XLE) and the Materials Sector SPDR® ETF (XLB). Looking back one year, TACK has not held exposure to either of these sectors due to their weak long-term momentum profiles. This has been beneficial to performance over that period since both sector ETFs have lagged SPY dramatically.
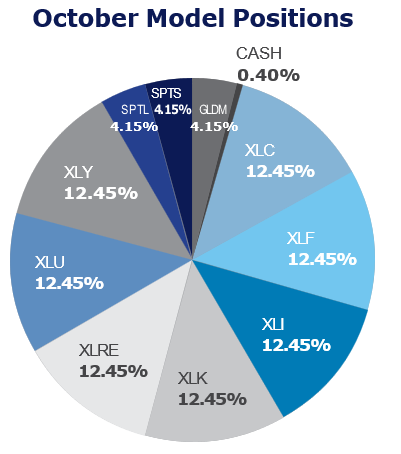
Positioning remained disciplined throughout Q3, with primarily “risk-on” positioning (i.e., sector ETFs) in a momentum driven tape. Currently, equity exposure for the fund is approximately 87.2%, with the balance in our “risk-off” sleeve—Treasuries and gold—consistent with our rules-based process that allocates across eight equal 12.5% buckets. TACK’s allocations to gold and defensive sectors, like utilities, complemented upside leadership from technology, communication services, and consumer discretionary, contributing to strong absolute and relative results for the quarter.
Looking ahead to Q4, we will continue to let the model drive exposure as sector leadership evolves. For October, the model made no changes since our technical indicators point higher for the same seven sectors it held in September. If momentum broadens beyond megacaps, our equal-weight, sector-rotation approach is well positioned to participate; if volatility resurfaces, the Treasury and gold sleeves offer a systematic path to reduce risk. As always, our mandate is unchanged: pursue capital appreciation with controlled drawdowns in a systematic manner.
Managing Megacap Exposure
In 2025, the S&P 500 Index has been led by a concentrated group of megacap stocks in the technology and communication services sectors, not dissimilar to markets in 2023 and 2024. This group has shown a loss of intermediate term upside momentum recently, which could become a drag on major indices in the near term.
Defensive sectors like utilities should rotate into favor in a weaker tape. That said, we are respectful of the technology sector in the longer term, particularly on the backside of any corrective action in markets. TACK’s systematic methodology acts on monthly data and signals to help ensure exposure to long-term uptrends. That methodology has maintained technology exposure for the bulk of the last three calendar years.
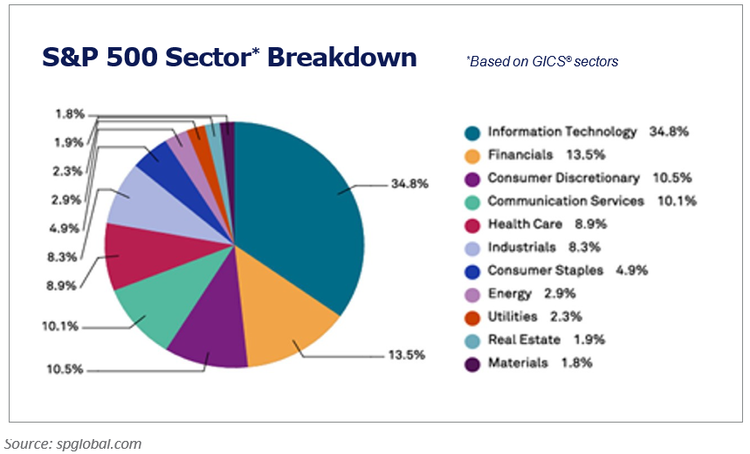
The index-level math is unforgiving when a handful of names dominate the weight in the major indices. As of September 30, the top 10 constituents of the S&P 500 Index make up roughly 39% of the index,
and the technology sector accounts for nearly 35%. We address that single-cohort risk by anchoring decisions to sector trend momentum rather than market-capitalization and by refreshing exposure to sectors on a set monthly schedule. The structure of TACK’s model allows for participation in durable themes but does not allow any one sector to dictate portfolio risk.
Looking ahead, the key variable is whether leadership broadens beyond the megacaps. When outperformance widens alongside breadth, our process stands to benefit from exposure to other sectors, like industrials and financials—while maintaining exposure to technology, as long as its cyclical uptrend remains healthy by our technical metrics.
By Katie Stockton, portfolio manager
Originally published by Fairlead
For more news, information, and analysis, visit the ETF Strategist Content Hub.
Performance data shown represents past performance and is no guarantee of, and not necessarily indicative of, future results. Current performance may be lower or higher than quoted. Returns include changes in share price and reinvestment of dividends, if any. For fund performance information current to the most recent month-end, please call 1-877-865-9549.
Total return and value will vary, and you may have a gain or loss when shares are sold. Returns include changes in share price and reinvestment of dividends, if any.
Market returns are based upon the closing price at 4:00 p.m. Eastern time, when the NAV is normally calculated for ETFs. Your returns may differ if you traded shares at other times. NAV returns represent the closing price of underlying securities.
Investors should carefully consider the investment objectives, risks, charges and expenses of the fund before investing. The prospectus contains this and other information about the fund, and it should be read carefully before investing. Investors may obtain a copy of the prospectus by calling 877-865-9549, emailing [email protected] or it may be download here.
The fund is distributed by Northern Lights Distributors, LLC (Member FINRA). Northern Lights Distributors, LLC, Fairlead Strategies, LLC, and Cary Street Partners Asset Management LLC are separate and unaffiliated. Cary Street Partners is the trade name used by Cary Street Partners LLC, Member FINRA/SIPC; Cary Street Partners Investment Advisory LLC and Cary Street Partners Asset Management LLC, registered investment advisers. Cary Street Partners is the Adviser for the Fairlead Tactical Sector ETF (TACK). For full disclaimers and disclosures, please view Disclaimers and Disclosures.
Fairlead Strategies, LLC is a registered investment adviser and the Subadviser for TACK. For access to the full disclaimers and disclosures for Fairlead Strategies, including their policy regarding editor securities holdings, go to https://www.fairleadstrategies.com/disclaimers-and-disclosures or email [email protected].
Notice of Benchmark Change: Effective as of 07/31/2024, the Russell 1000 Equal Weight Index replaced the Morningstar Moderate Target Risk Index as the Fund’s broad-based securities market index. The Russell 1000 Equal Weight index was selected in connection with certain regulatory requirements to provide a broad measure of market performance. The Fund will retain the Morningstar Moderate Target Risk Index as a secondary benchmark.
Important Risk Information:
Investing involves risk, including loss of principal. There is no guarantee the fund will achieve its investment objective. As an actively-managed ETF, the fund is subject to management risk. The ability of the Adviser to successfully implement the fund’s investment strategies will significantly influence the fund’s performance. The success of the fund will depend in part upon the skill and expertise of certain key personnel of the Adviser, and there can be no assurance that any such personnel will be successful. Neither the Adviser nor the Subadviser has previously served as an adviser or a subadviser to a mutual fund or exchange-traded fund. As a result, there is no long-term track record against which an investor may judge the Adviser and/or Subadviser.
The TACK ETF is structured as a fund-of-funds and are subject to the same risks as the Funds they hold. Investors will incur the expenses of the Fund in addition to fees of the underlying Funds in the portfolio.
The Adviser may allocate more of the Fund’s investments to a particular sector or sectors in the market, including the following sectors: Communications Services, Consumer Discretionary, Consumer Staples, Energy, Financials, Health Care, Industrials, Materials, Real Estate, Technology, and Utilities. If the Fund invests a significant portion of its total assets in a certain sector or certain sectors, its investment portfolio will be more susceptible to the financial, economic, business, and political developments that affect those sectors than a fund that is more diversified.
The Morningstar U.S. Tactical Allocation category consists of 21 ETFs.
The Morningstar Moderate Target Risk Index is designed to meet the needs of investors who would like to maintain a target level of equity exposure through a portfolio diversified across equities, bonds, and inflation-hedged instruments. The Morningstar Moderate Target Risk Index seeks approximately 60% exposure to global equity markets.
Morningstar Category/Morningstar Category % Rank Investments are placed into Morningstar categories based on their compositions and portfolio statistics so that investors can make meaningful comparisons. Morningstar Category % Rank is a fund’s total-return percentile rank relative to all funds in the same category. The highest (or most favorable) percentile rank is one and the lowest (or least favorable) percentile rank is 100. The Category % Rank complements the Morningstar Rating, especially for funds in smaller categories because these funds may have received a 3-star rating but
could be in the top half of their category performance.
Important Terms and Definitions: A basis point is a standard measure of percentages in finance that equals 1/100th of a percent (i.e., 0.1%). A risk-adjusted return is a calculation of the profit from an investment that considers the degree of risk that must be accepted to achieve it. The risk is measured in comparison to that of a virtually risk-free investment. Our Risk-Off Classification applies when the TACK strategy invests in
Treasury ETFs and Gold Shares to reduce market exposure. MACD stands for “Moving Average Convergence Divergence,” a common technical indicator designed to gauge price momentum. 20251009-4882337

