

SUMMARY
- The Fed is on the investor’s side as it pivots to fight inflation.
- The US Trend remains positive but slows to a more sustainable level.
- The Crowd is neutral, enhancing our ability to hold equities, in our opinion.

Since the last update our Three Tactical Rules on January 21st, equity markets have moved sideways, as the S&P 500 continues to attempt to break above the elusive 7000 milestone. The S&P has been rangebound largely due to angst around the hyperscalers’ AI spending plans and less certainty of Fed rate cuts. These headwinds have made it difficult for the index to continue to appreciate further after rallying nearly 40% since the April 2025 low. Our Three Tactical Rules of ‘Don’t Fight the Fed,’ ‘Don’t Fight the Trend,’ and ‘Beware of the Crowd at Extremes’ have each undergone changes during this period, some more visible than others.
As we turn to preview the three Tactical Rules, the Fed has begun to pivot away from its laser-focused prioritization of employment, turning instead to fighting inflation. The Trend that was rising at a pace deemed unsustainable during our last update has now peaked and is starting to decelerate to a more sustainable level, improving our overall tactical rating. Lastly, the Crowd has tempered its enthusiasm, which in turn has helped it be additive to our tactical rating. The cumulative changes of the Three Rules prompted our ratings reversal from a ‘flashing yellow light’ to a ‘flashing green light;’ the rating previously held prior to our last update.
‘Don’t Fight the Fed’: Pivoting to Fighting Inflation - GREEN LIGHT
The Fed held rates steady at its January 28th meeting. Currently, the fed funds target range is 3.50 – 3.75%, and the effective fed funds rate to 3.64%. At its latest meeting, the Fed cited stabilization of the unemployment rate and solid economic growth as reasons for holding rates steady. Furthermore, the committee stated that monetary policy was appropriately positioned to manage its dual mandate, as upside risks to inflation and the downside risks to labor had diminished. Subsequently, recent employment data has come in stronger than expected, as the unemployment rate fell to 4.3%. The better-than-expected unemployment data has prompted Federal Open Market Committee (FOMC) members to focus more on fighting inflation.
Looking through the Fed’s preferred inflation lens of core PCE, inflation remains elevated at 3%. Hence, the renewed focus on inflation as the labor side of the ledger has improved. The pivot in focus by the FOMC since our last update has caused forecasters to push back expectations for rate cuts to resume in the second half of the year. Currently, the fed funds futures market is predicting the FOMC to cut rates twice in 2026. However, the strength of the US economy, as shown by the Atlanta Fed’s Q1 GDP growth forecast of 3.0% quarter-over- quarter, will short circuit these plans, in our opinion. We believe that if core PCE remains elevated, there is a possibility that the Fed will pursue fewer cuts. Therefore, we believe the Fed continues to be on the investor’s side. We maintain our rating of a ‘green light’ on Fed policy.
Internationally, the Bank of England (BOE) has been gradually lowering rates as it tries to normalize its policy rate. Like the Fed, the BOE left rates unchanged at its last meeting as well. The central bank held its policy rate at 3.75% at its February 5th meeting. The BOE is expected to continue its measured approach, as the interest rate swaps market does not expect another cut until mid-year. Meanwhile, the European Central Bank (ECB) is also expected to hold its deposit rate steady throughout 2026. With inflation near its 2% target, the central bank is comfortable holding rates steady, in our opinion. While the speed of monetary policy easing is different at each of the major central banks, we believe all are aligned with our ‘Don’t Fight the Fed’ mantra and are thus on the investor’s side. The Bank of Japan (BOJ) may be the one exception, as it is currently contemplating raising interest rates as upside inflation risk continues to increase.
‘Don’t Fight the Trend’: US Trend Slows to a More Sustainable Level - FLASHING GREEN
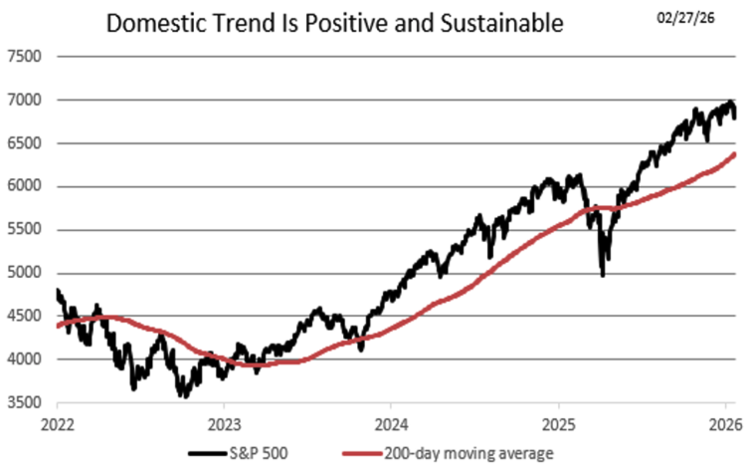
The primary trend on the S&P 500, which we define as the 200-day moving average (DMA), peaked over the last six weeks. Since our last update, the index has mostly traded sideways, only rising approximately 80 points and failing to break above 7000 as AI fears stalled the technology sector’s ascent. We believe this pause has helped the trend to slow down and return to a more sustainable level to facilitate positive returns over the next 3 to 6 months.
Currently, the trend is rising at a 31% annualized rate, but it will fall below 30% within the next week, in our opinion. Based on our previous research and experience, when the trend is rising between 20% and 30%, the S&P 500 has better-than-average odds of having a positive return over the next 3 to 6 months. While we are using history as our guide, we acknowledge that favorable odds don’t always guarantee success. However, we feel comfortable maintaining an overweight exposure to US stocks when the trend is positive. Currently, we view the domestic trend in a more positive light than in our previous update, given that it is now rising at a more sustainable rate. Thus, we are upgrading the Trend from a ‘yellow light’ to a ‘flashing green light.’
International Trend: Will Remain at Elevated Levels for Months - FLASHING RED
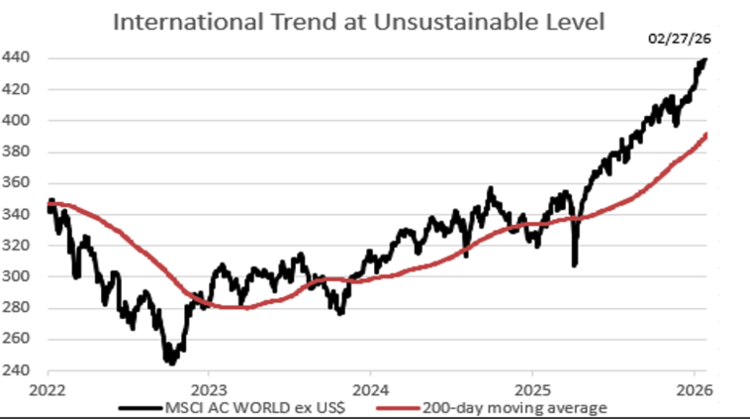
Internationally, the trend of the MSCI All Country World ex-US index (ACWX) has also peaked over the last 6 weeks. The run rate of the primary trend is currently rising at a 42% annualized rate, compared to a 45% annualized rate just two weeks ago. The strong international trend has led to international equities outperforming domestic equities by roughly 630 basis points since January 20th. However, the international trend currently is still running at a pace that we deem unsustainable.
If ACWX stays at its current level for the next month, we believe the trend will decelerate to a 34% annualized rate, which is closer to the 29% rate it registered in our last update. Our tactical work has shown that a positive trend increases the odds of a positive return over the next three to six months. However, when the trend gets too high, the odds no longer improve. This is the environment the international trend is currently experiencing. While we would applaud a slowing of the international trend to a more sustainable level, it is not going to happen overnight. Given that the international trend is predicted to remain above 30% for the next two months, we are downgrading it to a ‘flashing red light’ from a ‘yellow light’ in our last update.
Beware of the Crowd at Extremes: Poll Extremes Neutralize the Crowd - YELLOW LIGHT
We regard Crowd Sentiment as the ‘contrary’ indicator of the Three Tactical Rules. The chart below shows a measure of investor sentiment as calculated by Ned Davis Research (NDR). When the line is high it shows excessive optimism, and when it is low, extreme pessimism. NDR research suggests that historically, extreme pessimism can create attractive entry points for tactical investors. This is our preferred data source to measure investor psychology, though we use our own analytical framework from which to draw conclusions on sentiment.
Currently, the NDR Daily Sentiment and the NDR Weekly Sentiment Polls are giving opposite signals. Daily sentiment is at the top of the extreme pessimism zone, while weekly sentiment remains in the excessive optimism zone. The current condition is an improvement in sentiment since our last update. Historically, we have given more weight to the Weekly for this publication, despite incorporating both measures of sentiment in our overall rating. The Daily tends to be a good indicator of the investor’s ‘real time’ view of financial markets, while the Weekly gives longer term perspective of the Crowd.
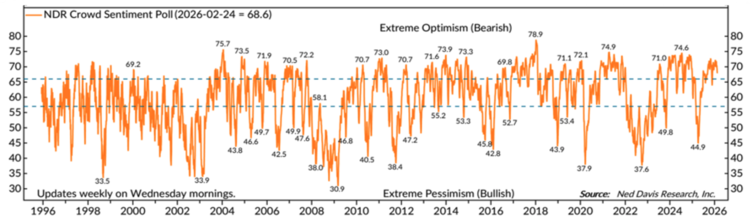
Given the current levels of the polls, we believe that the Crowd has become more neutral; the Weekly poll has fallen recently but still sits firmly in the middle of the extreme optimism zone. However, Daily sentiment has fallen from the neutral zone into the upper end of the extreme pessimism zone, thus creating mixed signals that would place our Crowd rating at neutral. At current levels, the shorter-term pessimistic crowd sentiment has made us more comfortable holding equities. Hence, we are upgrading our rating for the Crowd to a ‘yellow light’ from a ‘flashing red light’ in our previous update.
Conclusion: The Tactical Rules Are Bullish Preferring Stocks Over Bonds - FLASHING GREEN
The tactical rules signal a “a flashing green light” in the aftermath of the Fed holding rates steady, the Trend decelerating, and the Crowd being neutralized by sentiment polls that are viewing the market through different lenses. Given the fluidity of economic data, earnings guidance, and the mood of investors, the Three Rules are likely to move around further in the weeks to come. However, currently our Tactical Rules are giving a more bullish signal than our last update. Over the next 3 to 6 months, we believe that market conditions will continue to favor domestic and international equities over bonds as yields continue to fall.
Risk Discussion: All investments in securities, including the strategies discussed above, include a risk of loss of principal (invested amount) and any profits that have not been realized. Markets fluctuate substantially over time, and have experienced increased volatility in recent years due to global and domestic economic events. Performance of any investment is not guaranteed. In a rising interest rate environment, the value of fixed-income securities generally declines. Diversification does not guarantee a profit or protect against a loss. Investments in international and emerging markets securities include exposure to risks such as currency fluctuations, foreign taxes and regulations, and the potential for illiquid markets and political instability. Please see the end of this publication for more disclosures.
Authored by Kevin Nicholson
Originally posted on RiverFront Investment Group on March 3.
Important Disclosure Information:
The comments above refer generally to financial markets and not RiverFront portfolios or any related performance. Opinions expressed are current as of the date shown and are subject to change. Past performance is not indicative of future results and diversification does not ensure a profit or protect against loss. All investments carry some level of risk, including loss of principal. An investment cannot be made directly in an index.
Information or data shown or used in this material was received from sources believed to be reliable, but accuracy is not guaranteed.
This report does not provide recipients with information or advice that is sufficient on which to base an investment decision. This report does not take into account the specific investment objectives, financial situation or need of any particular client and may not be suitable for all types of investors. Recipients should consider the contents of this report as a single factor in making an investment decision. Additional fundamental and other analyses would be required to make an investment decision about any individual security identified in this report.
Chartered Financial Analyst is a professional designation given by the CFA Institute (formerly AIMR) that measures the competence and integrity of financial analysts. Candidates are required to pass three levels of exams covering areas such as accounting, economics, ethics, money management and security analysis. Four years of investment/financial career experience are required before one can become a CFA charterholder. Enrollees in the program must hold a bachelor’s degree.
All charts shown for illustrative purposes only. Technical analysis is based on the study of historical price movements and past trend patterns. There are no assurances that movements or trends can or will be duplicated in the future.
Ned Davis Research (NDR) is a global provider of independent investment research, solutions and tools. Founded in 1980, NDR helps clients around the world make objective investment decisions.
Stocks represent partial ownership of a corporation. If the corporation does well, its value increases, and investors share in the appreciation. However, if it goes bankrupt, or performs poorly, investors can lose their entire initial investment (i.e., the stock price can go to zero). Bonds represent a loan made by an investor to a corporation or government. As such, the investor gets a guaranteed interest rate for a specific period of time and expects to get their original investment back at the end of that time period, along with the interest earned. Investment risk is repayment of the principal (amount invested). In the event of a bankruptcy or other corporate disruption, bonds are senior to stocks. Investors should be aware of these differences prior to investing.
In general, the bond market is volatile, and fixed income securities carry interest rate risk. (As interest rates rise, bond prices usually fall, and vice versa). This effect is usually more pronounced for longer-term securities). Fixed income securities also carry inflation risk, liquidity risk, call risk and credit and default risks for both issuers and counterparties. Lower-quality fixed income securities involve greater risk of default or price changes due to potential changes in the credit quality of the issuer. Foreign investments involve greater risks than U.S. investments, and can decline significantly in response to adverse issuer, political, regulatory, market, and economic risks. Any fixed-income security sold or redeemed prior to maturity may be subject to loss.
Investing in foreign companies poses additional risks since political and economic events unique to a country or region may affect those markets and their issuers. In addition to such general international risks, the portfolio may also be exposed to currency fluctuation risks and emerging markets risks as described further below.
Changes in the value of foreign currencies compared to the U.S. dollar may affect (positively or negatively) the value of the portfolio’s investments. Such currency movements may occur separately from, and/or in response to, events that do not otherwise affect the value of the security in the issuer’s home country. Also, the value of the portfolio may be influenced by currency exchange control regulations. The currencies of emerging market countries may experience significant declines against the U.S. dollar, and devaluation may occur subsequent to investments in these currencies by the portfolio.
Foreign investments, especially investments in emerging markets, can be riskier and more volatile than investments in the U.S. and are considered speculative and subject to heightened risks in addition to the general risks of investing in non-U.S. securities. Also, inflation and rapid fluctuations in inflation rates have had, and may continue to have, negative effects on the economies and securities markets of certain emerging market countries.
Technology and internet-related stocks, especially of smaller, less-seasoned companies, tend to be more volatile than the overall market.
Artificial intelligence, or AI, refers to the simulation of human intelligence by software-coded heuristics. Nowadays this code is prevalent in everything from cloudbased, enterprise applications to consumer apps and even embedded firmware.
Index Definitions:
Standard & Poor’s (S&P) 500 Index measures the performance of 500 large cap stocks, which together represent about 80% of the total US equities market.
MSCI ACWI ex USA Index captures large and mid cap representation across approximately 22 of 23 developed markets (DM) countries (excluding the US) and approximately 25 emerging markets (EM) countries.
Definitions:
The 200-day moving average is a popular technical indicator which investors use to analyze price trends. It is simply a security’s average closing price over the last 200 days.
A basis point is a unit that is equal to 1/100th of 1%, and is used to denote the change in a financial instrument. The basis point is commonly used for calculating changes in interest rates, equity indexes and the yield of a fixed-income security. (bps = 1/100th of 1%).
Core CPI, or Core Consumer Price Index, is an economic indicator that reflects the average change over time in the prices paid by urban consumers for a basket of goods and services, excluding food and energy prices.
US Equities include stocks listed in the United States. Stocks represent partial ownership of a corporation. If the corporation does well, its value can increase, and investors can share in the appreciation. However, if it goes bankrupt, or performs poorly, investors can lose their entire initial investment (i.e., the stock price can go to zero). Small/mid-cap equities, MLPs, REITS and alternatives equities are types of US Equities and assume further risks described below.)
Federal Open Market Committee (FOMC) refers to the branch of the Federal Reserve System (FRS) that determines the direction of monetary policy in the United States by directing open market operations (OMOs). The committee is made up of 12 members, including seven members of the Board of Governors, the president of
The European Central Bank (ECB) is the central bank responsible for monetary policy of the European Union (EU) member countries that have adopted the euro currency. This currency union is known as the eurozone and currently includes 19 countries. The ECB’s primary objective is price stability in the euro area.
The Bank of England (BoE) is the central bank of the United Kingdom. The BoE oversees monetary policy and issues currency. It also regulates banks, financial firms, and payment systems. Like other central banks, the BoE may act as a lender of last resort in a financial crisis.
The Bank of Japan (BOJ) is the Japanese central bank, which is responsible for issuing and handling currency and treasury securities, implementing monetary policy, maintaining the stability of the Japanese financial system, and providing settling and clearing services.
The swaps market is an over-the-counter financial market where two parties exchange cash flows or liabilities based on specified terms
Inflation is a gradual loss of purchasing power, reflected in a broad rise in prices for goods and services over time.
Interest rate sensitivity is a measure of how much the price of a fixed-income asset will fluctuate as a result of changes in the interest rate environment. Securities that are more sensitive have greater price fluctuations than those with less sensitivity. This type of sensitivity must be taken into account when selecting a bond or other fixed-income instrument the investor may sell in the secondary market. Interest rate sensitivity affects buying as well as selling.
Don’t Fight the Fed – ‘Supportive’ means the Fed’s monetary policy regarding inflation and employment is in what we believe based on our analysis to be the investors’ best interest; ‘Against’ means the Fed’s monetary policy, in our view, is going against the investors’ best interest; ‘Neutral’ means the Fed’s monetary policy is neither supportive or against the investors’ best interest in our view. Don’t Fight the Trend – Terms correlate to the 200-day moving average as it relates to the equity indexes: ‘Positive’ means that the trend is rising, ‘Flat’ means the trend is flat, ‘Negative’ means the trend is falling. Beware the Crowd at Extremes – Terms correlate to the NDR Crowd Sentiment Poll and its measurement of Extreme Optimism (Bearish), Neutral, or Extreme Pessimism (Bullish).
RiverFront Investment Group, LLC (“RiverFront”), is a registered investment adviser with the Securities and Exchange Commission. Registration as an investment adviser does not imply any level of skill or expertise. Any discussion of specific securities is provided for informational purposes only and should not be deemed as investment advice or a recommendation to buy or sell any individual security mentioned. RiverFront is affiliated with Robert W. Baird & Co. Incorporated (“Baird”), member FINRA/SIPC, from its minority ownership interest in RiverFront. RiverFront is owned primarily by its employees through RiverFront Investment Holding Group, LLC, the holding company for RiverFront. Baird Financial Corporation (BFC) is a minority owner of RiverFront Investment Holding Group, LLC and therefore an indirect owner of RiverFront. BFC is the parent company of Robert W. Baird & Co. Incorporated, a registered broker/dealer and investment adviser.
To review other risks and more information about RiverFront, please visit the website at riverfrontig.com and the Form ADV, Part 2A. Copyright ©2026 RiverFront Investment Group. All Rights Reserved. ID 5263661

