

Seasonality is a broad concept that can be analyzed in many ways. One common approach is to examine the average monthly returns of a stock index to identify typical yearly patterns, leading to popular adages like “sell in May and go away.”
Recently, much attention has focused on the 4-year presidential election cycle, with other studies citing returns based on the political party in power.
While these topics make for interesting discussions, creating repeatable trading rules around them can be challenging.
In this note, we simplify seasonality to a trading rule derived by this question: What if we own the S&P 500 on the last trading day of each month and sell after four days?
This pattern is what is known as the turn-of-the-month effect.
Example System
In a paper titled, “Calendar Anomalies in Stock Index futures”, the authors concluded that, “our analysis reveals that the turn-of-the-month effect in S&P 500 futures contracts is the only calendar effect that is statistically and economically significant and persistent over time.”
To replicate this study, we use S&P 500 index price data from Norgatedata.com covering the period from 1980 through Q3 2024.
The turn of the month strategy buys the index at the close on the day before month-end and sells at the close on the third day of the new month. The chart displays the equity curve for this approach in yellow along with the equity curve for all other days shown in black.
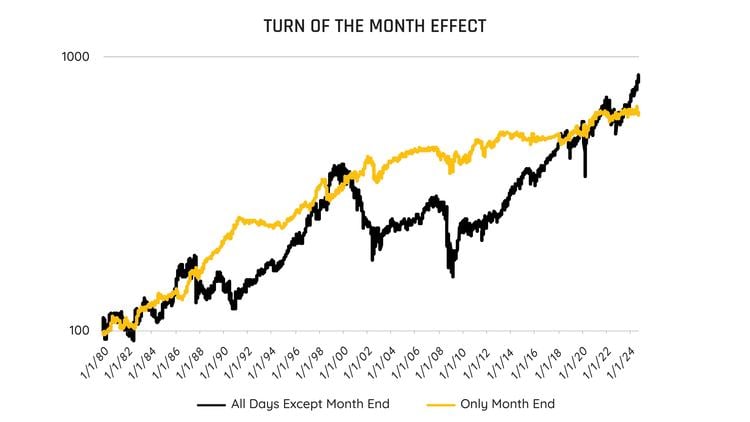
To provide a detailed comparison of the performance, the following summary table presents key metrics from the equity curves shown in the chart. This data helps to illustrate the drastic differences between the two.
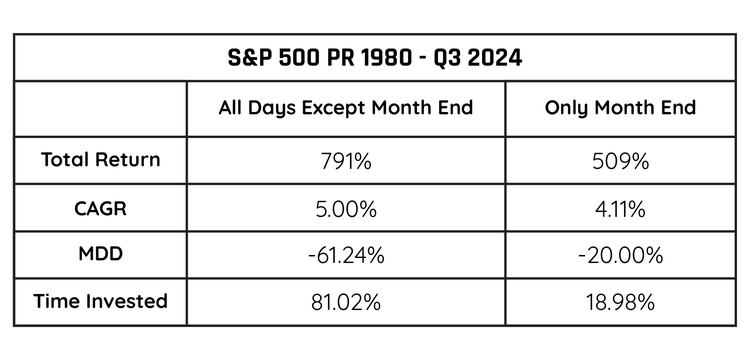
As the table illustrates, holding stocks for just four days each month resulted in an annual return that was only 0.89% lower than the return from being invested on all other days. The maximum drawdown was only 20%.
Going a step further to analyze the robustness of this effect, a 2014 study found that “the findings support the persistence of the specific calendar effect in 19 out of 20 countries examined.”
This suggests that the turn-of-the-month effect is not only present in the U.S. but also in 19 of the 20 global markets analyzed.
Potomac Application
While we do not utilize the exact month-end seasonality system outlined above, we do use one that is similar. Our work has uncovered that static parameters for each month do not necessarily yield the optimal outcome when combined with other systems that we use. For instance, we do not buy the same number of days and hold the same number of days each month.
Additionally, our work has uncovered that certain months are better than others for this month-end anomaly. For instance, the summer months are less conducive to this trading signal. Perhaps there is a tangent to the “sell in May and go away” phenomena.
While trading at the end of the month appears to be a viable strategy on its own, we are always interested in how strategies combine to create a whole that can be greater than the sum of its parts. We construct composite systems following the mantra of “great alone but better together.”
A key to these combinations is to find systems that have low or no correlation to each other. A system that trades simply based on the day of the month fits the bill nicely.
For more news, information, and analysis, visit the ETF Strategist Channel.
Disclosure Information
Disclosure: Past performance does not guarantee future results. There is no guarantee that any investment strategy or account will be profitable or will avoid loss. Individual investors’ objectives, financial situations, their specific instructions, or restrictions on investments, or the time at which an account is opened, or additions are made may result in different trades and returns. Performance for the strategy presented may differ materially (more or less) from the performance of the comparable benchmark and other Potomac investment strategies. Market and economic conditions could change in the future producing materially different returns. You cannot invest directly in an index. This presentation is supplemental to the composite report. This information is prepared for general information only and should not be considered as individual investment advice nor as a solicitation to buy or offer to sell any securities. This material does not constitute any representation as to the suitability or appropriateness of any investment advisory program or security. Please note that back tested results are hypothetical in nature. Hypothetical performance has been prepared with the benefit of hindsight. Hypothetical performance does not guarantee any future results. Hypothetical performance has certain risks and limitations that should be considered. More information about these risks and limitations are available upon request. Please visit our FULL DISCLOSURE page.
PFM-369-20241030

