
How Financial Advisors Can Help Their Clients Navigate Turbulent Economic Times
Don’t Panic
In the face of pessimism about the possibility of a recession and the Fed’s efforts to curb inflation at any cost, many investors may be worried. An analysis of the historical data from past recessions suggests that waiting for favorable market conditions could leave an investor at a disadvantage, compared to those who remain in, or enter, the market, irrespective of current conditions.
Financial advisors are right to recognize current market conditions as a concern. Investors, often pessimistic when driven by fear, may opt for inaction instead of having a candid discussion about recession, inflation, and Fed policy. A look back at history prepares financial advisors to initiate meaningful conversations with their clients about the opportunities and pitfalls of greater uncertainty.
Recession 101
Though there’s a common notion that a recession is any time GDP declines for two consecutive quarters, the National Bureau of Economic Research (NBER) Business Cycle Dating Committee (BCDC), defines a recession as “a significant decline in economic activity that is spread across the economy and that lasts more than a few months.” Variables such as industrial production, employment in nonfarm sectors, and consumer purchases are evaluated by the BCDC to demarcate – in hindsight – specific calendar dates as economic peaks and troughs.
A recession is an important economic event because it impacts bond and equity prices. Furthermore, Federal Reserve actions such as raising interest rates are consequential to borrowers, consumers, and savers. It’s important that advisors collect information about business cycle characteristics and speak candidly with those they serve.
The stress in both bond and equity markets in 2022 to date reflects current macro-economic issues, especially inflation, and heightened market volatility. These issues, and the Fed’s efforts to fight inflation by aggressively raising interest rates, have led to lower investor confidence, pricing in a potential recession. Few economists consider that the United States is already in a recession—even though U.S. real GDP fell for two consecutive quarters in 2022, data reflects strong employment and consumer spending. Regardless, NBER would only tell us at a later stage if we were in a recession today, and that would not matter to investors who will have already reacted to much of the same signals as those used by the NBER.
Analyze Past Recession Data for Better Decision-Making
Those who understand the forward-looking nature of the market understand that markets can and do fluctuate. They understand recessions are an inevitable part of the business cycle and that utilizing markets for investing is not the same as short-term trading.
As shown in Figure 1, the Standard and Poor’s 500 Index, referred to as the S&P 500 Index, steadily rose, with occasional dips, between January 1960 and July 2022. A long-term focused investor, with a relatively consistent allocation to equities, would have avoided the problem of taking losses due to a premature exit from stocks. An inspection of Table 1 further supports the merits of remaining invested in the market for investors seeking to satisfy long-term goals, even when potentially in the middle of a recession.
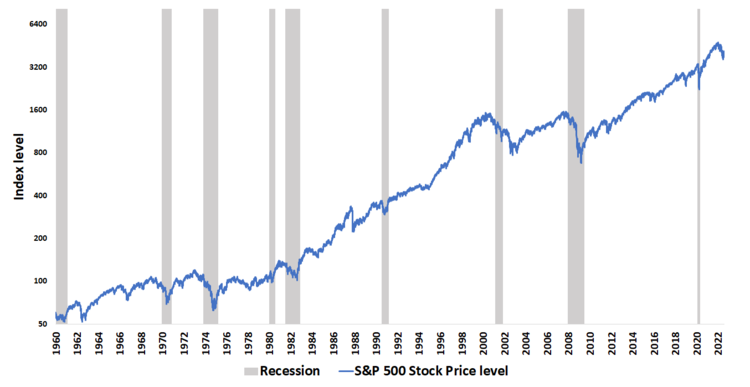
Table 1: Historical Recessions and Return Characteristics
| Peak of Economic Cycle (Start of Recession) | Trough of Economic Cycle (End of Recession) | Duration of the Recession (Months) | Return from Start to End of Recession | 1-Year Forward Return from Start of Recession | 2-Year Forward Return from Start of Recession | 1 Year Forward Return Starting 6 Months into the Recession |
|---|---|---|---|---|---|---|
| Apr 1960 | Feb 1961 | 10 | 14.6% | 20.5% | 33.6% | 29.1% |
| Dec 1969 | Nov 1970 | 11 | -7.0% | -2.3% | 8.7% | 33.3% |
| Nov 1973 | Mar 1975 | 16 | -19.6% | -28.4% | -9.8% | 0.2% |
| Jan 1980 | Jul 1980 | 6 | 9.5% | 26.0% | 53.1% | 18.6% |
| Jul 1981 | Nov 1982 | 16 | 12.7% | -10.5% | 44.2% | 19.4% |
| Jul 1990 | Mar 1991 | 8 | 6.0% | 7.3% | 21.7% | 32.0% |
| Mar 2001 | Nov 2001 | 8 | -11.9% | -9.6% | -30.1% | -21.4% |
| Dec 2007 | Jun 2009 | 18 | -33.9% | -38.1% | -22.4% | -30.1% |
| Feb 2020 | Apr 2020 | 2 | -23.1% | 17.2% | 41.8% | 35.2% |
| Average | 10.6 | -6% | -2% | 16% | 13% |
Notes: The percentage return for each economic cycle is the total return of the S&P 500 Index and sourced from Bloomberg. The Peak and Trough dates for each economic cycle are sourced from NBER. Percentages in the column titled “1-Year Forward Return from Start of Recession” reflect the total return of the S&P 500 Index starting from the peak of the economic cycle to a future date of 365 calendar days from the starting point. Percentages in the column titled “2-Year Forward Return from Start of Recession” is the total return of the S&P 500 Index starting from the peak of the economic cycle to a future date of 730 calendar days from the starting point. Percentages in the column titled “1-Year Forward Return 6 Months into the Recession” reflect the total return of S&P 500 Index starting at a date which is 6 months from the peak of the economic cycle to a future date of 365 days from that date.
NBER measures recessions from “peak” to “trough”. The recession starts at the backward-looking economic peak and ends at the trough of economic indicators. During the period from January 1960 to June 2022, the NBER classified nine recessions with an average length from peak to trough of 10.6 months. With each recession, the S&P 500 declined before, during, and sometimes after, the official end of the recession. Notably, the S&P 500 level also fell before most recessions, reflecting the market consensus of an imminent slowing of economic growth. The data also shows peak-to-trough positive returns for five out of nine recessions which is contrary to the popular belief that recessions generally yield negative market returns for investors.
To give financial advisors a better sense of how the market compensated the investors during recessionary periods, the New Frontier Advisors team calculated both 1-Year and 2-Year forward S&P 500 returns from each NBER-classified peak. While the 1-Year forward returns were predominantly negative for most of the peak dates listed, the 2-Year forward returns for six of nine peak dates were positive.
Risk Matters
During a recession, risk rises, rendering a historical returns-only perspective insufficient for a financial advisor to adequately interpret past market performance. According to the NBER data, the annualized standard deviation of S&P 500 Index returns, a measure of average volatility, was twenty-five percent during the recessions, whereas the annualized standard deviation of returns for the entire January 1960 to July 2022 period was considerably lower at sixteen percent.
Does Official News That We are in a Recession Matter?
Our most relevant statistic for investors is highlighted in the last column. The NBER identifies the peak (start) of the recession retrospectively, months after examining various macro-economic factors which are reported on a quarterly basis and lag actual market performance. Hence, we look at 1-Year forward returns starting 6 months after the peak of an economic cycle as, in our view, a reasonable proxy for when investors might get the official news of a recession if there is one. These returns are positive for seven out of nine past events. Conservatively, this implies there is not much evidence that the official news of a recession has had an adverse impact on future returns. In the current market scenario with U.S. real GDP declining in Q1-2022 and Q2-2022, the peak of a recession may be declared only after NBER has accumulated conclusive evidence that we are presently in a recession. However, historical analysis suggests that markets may then begin to rebound if the economy improves, irrespective of any official news of recession. Investors who wait until the recession is over could miss out on the upside gains.
Stay Focused
Recessions vary by duration and severity and therefore influence what commonsense solutions for preserving capital and generating income you discuss with your clients. As shown in Table 1, the shortest recession lasted two months, from February 1, 2020, to April 1, 2020. The longest recession recorded between 1960 and 2020 lasted eighteen months, starting on December 1, 2007, and ending on June 1, 2009. This shows that duration of recession alone doesn’t explain the overall impact on the economy, and each recession is caused by different underlying factors.
Present market conditions may prompt some investors to sell or wait until the market starts to uptrend. However, our historical analysis suggests waiting for such a favorable market scenario could leave an investor at a disadvantage, compared to those who stay invested in the market irrespective of current conditions. As New Frontier Advisor’s Managing Director of Research explains in Any Time is the Right Time to Start Investing, waiting for the perfect time to invest is ill-advised.
Given there is no free lunch in investing, with many bumps expected on the road to success, we aim to construct independently researched reliable long-term investment portfolios that are also short-term efficient. New Frontier’s patented investment process incorporates daily information about market conditions into thousands of scenarios of future asset class risks and returns, to uniquely account for uncertainty in capital markets and estimation error in the optimized portfolios, without trying to speculate on the future. We want investors to invest, and stay invested, without being at the mercy of any particular market scenario unfolding.
Knowledge is power. Understanding the life cycle of a recession is a great step in the right direction of helping your clients meet their long-term goals.
To learn more about New Frontier’s risk-return efficient portfolios, and how our investment process enables our portfolios to adapt to shifting and evolving markets, contact us at 617-482-1433, or at [email protected].
Disclosures:
New Frontier Advisors LLC (“New Frontier”) is a federally registered investment adviser based in Boston, MA. The information discussed here is for information purposes only. Past performance does not guarantee future results. As market conditions fluctuate, the investment return and principal value of any investment will change. Diversification may not protect against market risk. There are risks involved with investing, including possible loss of principal.

