

SUMMARY
- US large-cap is on a level of its own.
- Value-oriented markets take a step back.
- Earnings have become even more important as global markets face uncertainty.
While the world focuses on the "war in Iran,":https://www.riverfrontig.com/insights/iran-keeping-perspective-in-uncertain-times/ we would remind investors that corporate earnings trends are a more profound driver of stock prices over the intermediate-term than geopolitics. As such, moving forward we will be looking to earnings to help inform our scenario analysis. In the meantime, with almost all of the S&P 500 now having reported for the fourth quarter of 2025, it is time to step into the doctor’s office and perform our quarterly earnings season ‘checkup’. As always, our proverbial stethoscope for this ‘checkup’ is our three ‘earnings principles’:
- Earnings/Revenue Surprises: Were corporate results out of alignment with market expectations?
- Analyst Adjustments: What was the direction and magnitude of analysts’ estimate revisions after forward guidance was issued
- Earnings/Revenue Trends: What is the long-term earnings trend?
While we are looking for general earnings ‘health’, there are three questions we would specifically like to answer:
- Have tariffs caused disruptions in earnings?
- Are there any signs of ‘AI’ slowdown?
- Are earnings providing a catalyst for value-oriented equities?
Keeping these questions in mind, let’s start our ‘checkup’ with US large-cap equities. Overall, earnings remain strong and don’t seem to be showing signs of either tariff disruption or ‘AI’ slowdown. Starting with our first principle: S&P 500 aggregate earnings were 6.8% higher than analyst expectations, with only the utility sector posting earnings lower than expectation. Technology earnings were even stronger, surpassing expectations by 7.6%.
Earnings surprises: From a revenue perspective, we were also encouraged by sales coming in 1.8% higher than analysts expected, with only consumer staples falling short – and even then, sales were essentially flat to expectations, skewed by a handful of companies facing more idiosyncratic headwinds. Viewed through the lens of principle one, fears raised by tariff and AI uncertainty appear largely assuaged.
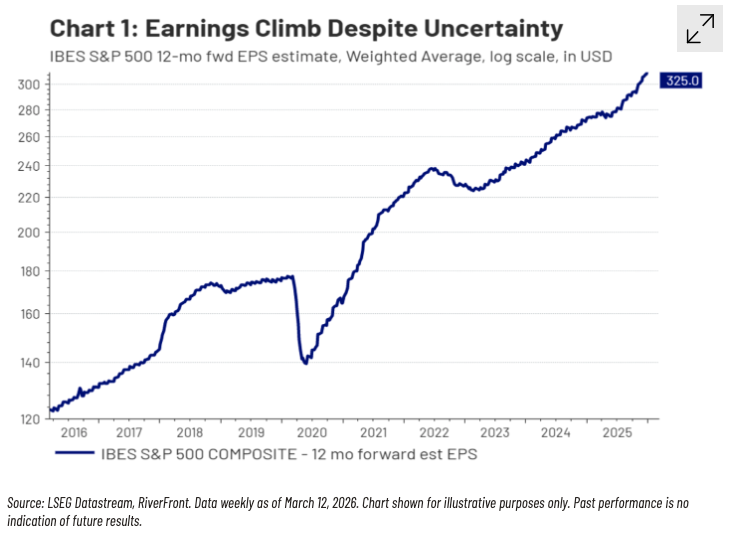
Moving to our second principle, forward earnings expectations for the S&P 500 over the next 12 months have ticked upward in response to these positive surprises (see Chart 1, above). Consistent with our take on sales, analysts continue to see a path for US large-caps to sustain earnings growth.
Our final principle continues to demonstrate the strength of S&P 500 earnings, with both year-over-year earnings and sales growth ticking up to 13.6% and 9.2%, respectively. The Energy sector had negative sales growth due to lower crude oil prices in the fourth quarter of 2025 versus 2024, though positive earnings growth points toward continued efficiency gains in US oil fields. Consumer discretionary’s negative earnings growth was driven primarily by the automobile and homebuilding industries. In our view, both of these shortfalls are largely industry specific, with tariff-driven input costs creating headwinds.
From a thematic standpoint, AI earnings trends remain strong with the technology sector growing 32.5% year-over-year. Also, we are seeing earnings strength in more cyclical-oriented sectors with strong earnings growth in Industrials (34.8%) and materials (24.1%). We believe AI-driven infrastructure build provided a tailwind for these earnings.
Beyond Large-Cap
More Value-Oriented Markets, US Small-Caps, Europe and Japan Take a Step Back
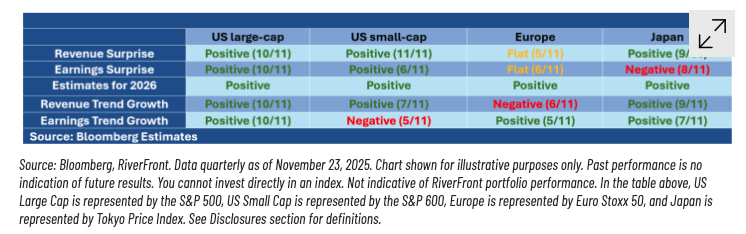
The table above summarizes RiverFront’s view of the earnings picture for four different market segments: US large-cap, small-cap, Europe and Japan. Comparing these segments can help answer our question about value vs growth. US Small-cap, European, and Japanese equities tend to have a greater weighting in more value-oriented sectors, meaning they can provide us insight into whether earnings can provide a catalyst to a value rotation. Additionally, we can compare how each of these markets has changed from last quarter, in order to determine if there is a trend forming. Here is a quick ‘checkup’ for the three non US large-cap market segments:
- US small-cap: Small-cap earnings remained strong based on principle one and two. However, its earnings growth trend turned negative this quarter, with only five sectors having positive growth. One specifically concerning sector is financials, which often represents a bellwether for the broad small-cap market. There are still some sectors that have maintained a positive trend, so there is potential for specific, selection-led investments, though the strength of the large-cap market makes those opportunities less attractive.
- Europe: Last quarter, Europe was the least ‘healthy’ of the four markets we performed a ‘checkup’ on, but it was showing signs of improvement. This improvement has faltered with earnings surprise moving from positive to flat and revenue growth falling from flat to negative. This sales growth (or lack thereof) is particularly concerning given we had hoped the foundation for a value rotation would be elevated, but moderated inflation driving revenues higher.\
- Japan: In the third quarter, we noted an impressive turnaround for Japan that for the most part continued into the fourth quarter, with four of our five indicators remaining positive. The lone exception, earning surprises, was turned negative, though 8 of the 11 sectors had positive surprises. Overall, Japan is relatively ‘healthy,’ though we continue to look for improved consistency between ‘checkups’.
Conclusion
US Large-Cap Remains King; Earnings ‘Checkups’ Have Become Even More Important Moving Forward
The fourth quarter earnings season provided a very strong ‘checkup’ for US large-cap to cap off a very ‘healthy’ earnings year for US large-cap. Each of the three more value-oriented markets we evaluated took a step back from their third quarter ‘checkup’ though, for the most part, all have shown solid progress throughout the year. However, tension in the middle east has created many more pitfalls for "global markets moving forward.":https://www.riverfrontig.com/insights/iran-keeping-perspective-in-uncertain-times/ As such, future earnings analysis as well as market momentum becomes increasingly important in identifying when and where markets are being affected by the fall out of these geopolitical events. We are particularly sensitive to these market signals in our shorter-horizon, lower risk-tolerance portfolios.
Our portfolios are positioned consistently with the takeaways of this analysis. We continue to be overweight US large cap stocks across our balanced portfolios. We have also made selective investments in Europe and Japan, with distinct tilts towards Value and Financials. Moving forward, we will be monitoring corporate surveys, business confidence, earnings guidance and analyst revisions to assess how global markets are navigating the increasingly complex path forward. These more forward-looking and frequent data points can inform us until our next ‘checkup’.
For more news, information, and analysis, visit the ETF Strategist Content Hub.
Originally posted on RiverFront Investment Group on March 17.
Risk Discussion: All investments in securities, including the strategies discussed above, include a risk of loss of principal (invested amount) and any profits that have not been realized. Markets fluctuate substantially over time, and have experienced increased volatility in recent years due to global and domestic economic events. Performance of any investment is not guaranteed. In a rising interest rate environment, the value of fixed-income securities generally declines. Diversification does not guarantee a profit or protect against a loss. Investments in international and emerging markets securities include exposure to risks such as currency fluctuations, foreign taxes and regulations, and the potential for illiquid markets and political instability. Please see the end of this publication for more disclosures.
_
Important Disclosure Information_
The comments above refer generally to financial markets and not RiverFront portfolios or any related performance. Opinions expressed are current as of the date shown and are subject to change. Past performance is not indicative of future results and diversification does not ensure a profit or protect against loss. All investments carry some level of risk, including loss of principal. An investment cannot be made directly in an index.
Information or data shown or used in this material was received from sources believed to be reliable, but accuracy is not guaranteed.
This report does not provide recipients with information or advice that is sufficient on which to base an investment decision. This report does not take into account the specific investment objectives, financial situation or need of any particular client and may not be suitable for all types of investors. Recipients should consider the contents of this report as a single factor in making an investment decision. Additional fundamental and other analyses would be required to make an investment decision about any individual security identified in this report.
Chartered Financial Analyst is a professional designation given by the CFA Institute (formerly AIMR) that measures the competence and integrity of financial analysts. Candidates are required to pass three levels of exams covering areas such as accounting, economics, ethics, money management and security analysis. Four years of investment/financial career experience are required before one can become a CFA charterholder. Enrollees in the program must hold a bachelor’s degree.
All charts shown for illustrative purposes only. Technical analysis is based on the study of historical price movements and past trend patterns. There are no assurances that movements or trends can or will be duplicated in the future.
Stocks represent partial ownership of a corporation. If the corporation does well, its value increases, and investors share in the appreciation. However, if it goes bankrupt, or performs poorly, investors can lose their entire initial investment (i.e., the stock price can go to zero). Bonds represent a loan made by an investor to a corporation or government. As such, the investor gets a guaranteed interest rate for a specific period of time and expects to get their original investment back at the end of that time period, along with the interest earned. Investment risk is repayment of the principal (amount invested). In the event of a bankruptcy or other corporate disruption, bonds are senior to stocks. Investors should be aware of these differences prior to investing.
In general, the bond market is volatile, and fixed income securities carry interest rate risk. (As interest rates rise, bond prices usually fall, and vice versa). This effect is usually more pronounced for longer-term securities). Fixed income securities also carry inflation risk, liquidity risk, call risk and credit and default risks for both issuers and counterparties. Lower-quality fixed income securities involve greater risk of default or price changes due to potential changes in the credit quality of the issuer. Foreign investments involve greater risks than U.S. investments, and can decline significantly in response to adverse issuer, political, regulatory, market, and economic risks. Any fixed-income security sold or redeemed prior to maturity may be subject to loss.
Investing in foreign companies poses additional risks since political and economic events unique to a country or region may affect those markets and their issuers. In addition to such general international risks, the portfolio may also be exposed to currency fluctuation risks and emerging markets risks as described further below.
Changes in the value of foreign currencies compared to the U.S. dollar may affect (positively or negatively) the value of the portfolio’s investments. Such currency movements may occur separately from, and/or in response to, events that do not otherwise affect the value of the security in the issuer’s home country. Also, the value of the portfolio may be influenced by currency exchange control regulations. The currencies of emerging market countries may experience significant declines against the U.S. dollar, and devaluation may occur subsequent to investments in these currencies by the portfolio.
Foreign investments, especially investments in emerging markets, can be riskier and more volatile than investments in the U.S. and are considered speculative and subject to heightened risks in addition to the general risks of investing in non-U.S. securities. Also, inflation and rapid fluctuations in inflation rates have had, and may continue to have, negative effects on the economies and securities markets of certain emerging market countries.
Technology and Internet-related stocks, especially of smaller, less-seasoned companies, tend to be more volatile than the overall market.
Artificial intelligence, or AI, refers to the simulation of human intelligence by software-coded heuristics. Nowadays this code is prevalent in everything from cloudbased, enterprise applications to consumer apps and even embedded firmware.
Index Definitions:
Standard & Poor’s (S&P) 500 Index measures the performance of 500 large cap stocks, which together represent about 80% of the total US equities market.
S&P 600 is a benchmark index for small-cap stocks. To be listed on the S&P 600, stocks must have a market cap of $850 million to $3.6 billion, preventing overlap with S&P’s larger cap indices.
EURO STOXX 50 is a stock index of Eurozone stocks designed by STOXX, an index provider owned by Deutsche Börse Group. The index is composed of 50 stocks from 11 countries in the Eurozone. EURO STOXX 50 represents Eurozone blue-chip companies considered as leaders in their respective sectors.
The Tokyo Price Index, known as TOPIX, is a Japanese stock market index calculated and published by the Tokyo Stock Exchange (TSE). TOPIX tracks domestic companies in the exchange’s first section, which represents Japan’s largest firms by market capitalization.
Definitions:
Inflation is a gradual loss of purchasing power, reflected in a broad rise in prices for goods and services over time.
The energy sector is a category of stocks that relate to producing or supplying energy. The energy sector or industry includes companies involved in the exploration and development of oil or gas reserves, oil and gas drilling, and refining. The energy industry also includes integrated power utility companies such as renewable energy and coal.
US Equities include stocks listed in the United States. Stocks represent partial ownership of a corporation. If the corporation does well, its value can increase, and investors can share in the appreciation. However, if it goes bankrupt, or performs poorly, investors can lose their entire initial investment (i.e., the stock price can go to zero). Small/mid-cap equities, MLPs, REITS and alternatives equities are types of US Equities and assume further risks described below.
The Institutional Brokers’ Estimate System (IBES) is a database used by brokers and active investors to access the estimates made by stock analysts regarding the future earnings of publicly traded American companies.
Earnings per share (EPS) is calculated as a company’s profit divided by the outstanding shares of its common stock. The resulting number serves as an indicator of a company’s profitability.
US large cap equities include equities of companies with a market capitalization of over $10 billion. Although large cap equities are generally considered to be safer securities, large cap equities are still subject to the risks associated with stocks.
Small-, mid- and micro-cap companies may be hindered as a result of limited resources or less diverse products or services and have therefore historically been more volatile than the stocks of larger, more established companies.
When referring to being “overweight” or “underweight” relative to a market or asset class, RiverFront is referring to our current portfolios’ weightings compared to the composite benchmarks for each portfolio. Asset class weighting discussion refers to our Advantage portfolios.
RiverFront Investment Group, LLC (“RiverFront”), is a registered investment adviser with the Securities and Exchange Commission. Registration as an investment adviser does not imply any level of skill or expertise. Any discussion of specific securities is provided for informational purposes only and should not be deemed as investment advice or a recommendation to buy or sell any individual security mentioned. RiverFront is affiliated with Robert W. Baird & Co. Incorporated (“Baird”), member FINRA/SIPC, from its minority ownership interest in RiverFront. RiverFront is owned primarily by its employees through RiverFront Investment Holding Group, LLC, the holding company for RiverFront. Baird Financial Corporation (BFC) is a minority owner of RiverFront Investment Holding Group, LLC and therefore an indirect owner of RiverFront. BFC is the parent company of Robert W. Baird & Co. Incorporated, a registered broker/dealer and investment adviser.
To review other risks and more information about RiverFront, please visit the website at riverfrontig.com and the Form ADV, Part 2A. Copyright ©2026 RiverFront Investment Group. All Rights Reserved. ID 5306986

