

Heading into last week, many major market indexes had entered “oversold” conditions. In other words, markets had declined to a point where they were “due” for a kickback rally. This has happened two other times in recent months, and in both cases, the rally fell short of being meaningful. Will this kickback be any different?
The market’s few “up” days last week were greater than most investors would have predicted. The kickback began on Wednesday as investors speculated that the Federal Reserve would be done raising interest rates for the year. This optimism continued into the end of the week.
So far, this recent market move has not started a new trend. As of this writing, the markets are still in a pattern over lower highs and lower lows that began in August. Maybe this trend will be broken, but there are a few concerns. These concerns are bulleted out below.
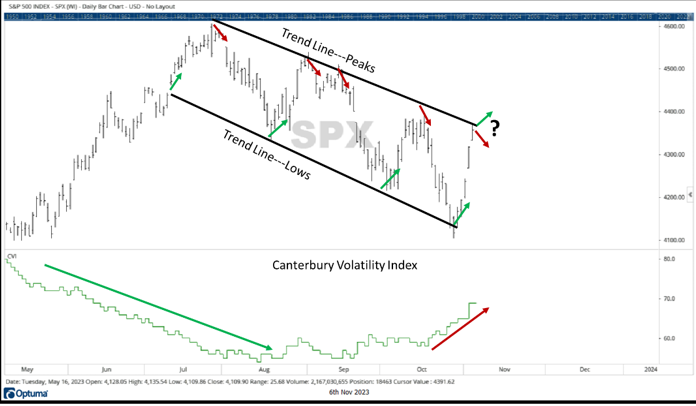
- The S&P 500 is trading in a clear channel of lower highs and lower lows. The chart above draws trend lines across previous highs and previous lows. Right now, the current price is at the upper end of the channel. This would typically be a point of resistance or a level where some selling may occur.
- The lower half of the chart shows the Canterbury Volatility Index (CVI). Declining volatility is an efficient or “normal” market characteristic. Rising volatility is a sign of an inefficient or “irrational” market. Since the beginning of August, volatility has been rising. Volatility showed a sharp rise last week during the market’s advance. In other words, the kickback rally has not appeared rational.
- The S&P 500 has been one of the strongest indexes in 2023 due to its heavy weighting towards a few larger stocks. Readers of our updates will be familiar with those stocks. On the other hand, the Russell 2000 (an index of small cap stocks) has been one of the weakest indexes and is in a long-term bear market. After surpassing last year’s lows, the Russell 2000 experienced the strongest advance last week, and featured two outlier days beyond +2.6%. Large, single-day advances that occur back-to-back are typical during a bear market.
- In addition to weak small cap stocks seeing the largest short-term rally, the S&P 500’s weakest sectors also saw the largest kickbacks. Real Estate and Consumer Discretionary saw the strongest upward moves last week. These two sectors had previously been the market’s worst performers during the decline seen from August to October.
Bottom Line & Portfolio Management
Last week, markets saw a kickback rally (following a decline) that was fueled by investor hopes about the Fed’s interest rate decisions. Hope is not a sound investment indicator. For the moment, this rally has yet to break the market’s trend of lower highs and lower lows. The weakest areas saw the biggest bounce. Those areas are in bear markets. Sharp, short-term rebounds are typical and expected during bear markets.
From a portfolio management perspective, there have not been many “conservative” areas in the markets. We have discussed in previous updates that bonds are in bear markets, and if interest rates do continue to rise, bond prices will continue to decline.
Our Adaptive methodology, the Canterbury Portfolio Thermostat, holds a variety of inverse positions that stabilize portfolio fluctuations during volatile markets. It also holds a few individual stock positions. These individual stocks all have positive technical characteristics, give the portfolio exposure to more potential upside, and currently exhibit a lower correlation to overall market fluctuations. Low correlations among the securities held in a portfolio decrease its volatility. Given the market’s rising risks, the Portfolio Thermostat aims to maintain relatively stable fluctuations in a market environment that could become increasingly volatile.
Canterbury’s team continues to monitor for any changes to market trends and volatility and continues to evaluate potential rotations. Last week, we published a video discussing the market’s movements as well as the Portfolio Thermostat’s recent fluctuations through October. A link to that video can be found here.
For more news, information, and analysis, visit the ETF Strategist Channel.

