

“Over time, it’s been more profitable to invest in small companies than in large companies. The successful small companies of today will become the WalMarts, Home Depots, and Microsoft’s of tomorrow.” – Peter Lynch
For the better part of the last decade, investors have enjoyed strong returns from their US equity portfolios, led by the performance of large dominant US companies, particularly growth stocks and even more specifically the Magnificent 7 stocks of Apple, Amazon, Alphabet(Google), Meta, Microsoft, Nvidia, and Tesla. Over this period, the S&P 500 has gained nearly 300% while the Mag 7 gained 2585%. The other 493 stocks advanced 200%. Still impressive, but for perspective the seven stocks of the Mag 7 contributed about 1/3 of the total gains of the entire S&P 500. Going one step further, US small cap stocks gained a modest 134%. This was truly a decade of dominance for large market cap names, growth stocks in particular. In hindsight, one could argue this was fairly obvious, driven by the excellence of some truly dominant companies. And, you would be correct in making that claim. However, dominance is rarely permanent. We’ve seen this throughout history with some genuinely great global giants fading into obscurity before reemerging again or, in some cases, disappearing all together. I must remind everyone that it wasn’t long ago, in 2011, that Exxon was the largest company in the S&P 500 while Apple ranked 2nd, and Nvidia 305th. Dominance can be a bit of a fleeting thing.
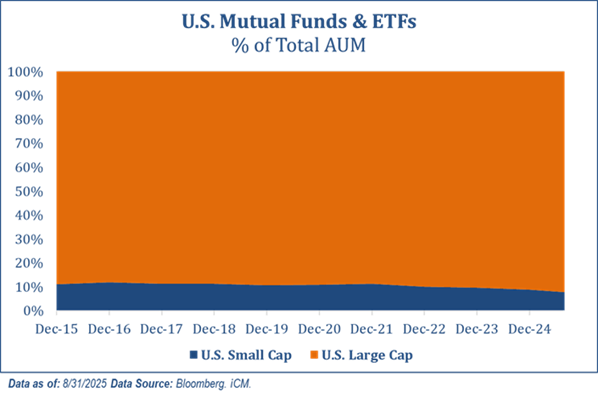
Even when we consider other periods of technological revolution, greatness can be temporary. Take for example the internet bubble era. In those days, Microsoft, Amazon, and Oracle were all fan favorites. While Amazon and Microsoft are part of the Mag 7, Oracle may not be far behind as it stakes its claim to being one of the AI greats. Regardless, it took these companies the better part of 20 years to return to their former glory. Given the recent dominance, it is not a stretch to assume that many investors may have become too comfortable, too reliant, and, dare I say, too concentrated in not only the Mag 7, but large cap and growth market segments. Take for example Chart 1 that highlights the asset allocation of all mutual fund and ETF investors since 2015 when investors held an average allocation of 12% to small cap. Today it sits at 8%. Is this a set up for continued success or future failure? History would point to the latter.
Chart 1
From a behavioral perspective, concentration in US large cap growth names is not surprising. In fact, investors frequently favor their home country. This is called home country bias. Going a step further, large companies get meaningfully more media coverage and attention than their smaller counterparts. Combine this with the allure of owning the very glamourous fast growers, “glamour stocks” as Fama and French referred to them, and you can easily see how US investors end up taking a disproportionate amount of risk in US large growth companies. More often than not, this is where we offer an alternate view, a competing opinion. Afterall, that is in our value-oriented, contrarian nature. We will get to that. But, it got me to thinking…if and when this dominant run does give way to something else taking the reins, what is more important to an investor, consistently being in the correct market cap or in the correct style? In this quarter’s Market Insights, “What matters more to investment results, market cap or style?” we hope to answer that very question.
Background
In investing, one is faced with an overwhelming array of choices on how to allocate portfolio dollars. As made famous in the Brinson, Hood & Beebower studies of 1986 and 1991, asset allocation accounts for over 90% of a portfolio’s performance variability or risk and 100% of the return given that items like active management and market timing were collective detractors in their study.
Thirty years ago, the idea of a passive mix of assets being more important than “picking good stocks” was a rather large shock to what was common, at least as it relates to individual investor portfolio management. It was a stock pickers paradigm. Roll forward 30-40 years and that paradigm has shifted, with concepts like asset allocation becoming rather commonplace. In the institutional world, it’s rare not to see a plan with some semblance of a reasonable asset mix.In the individual investing world, most investors have access to managed programs through professional advisors, robo-advisors, or mutual fund complexes. These programs will assess risk and return objectives and produce a reasonable portfolio recommendation diversified between stocks and bonds, US and international, and within the US, large and small market caps as well as growth and value styles. While the concept has become common, the approach to developing an appropriate mix of assets has evolved and can vary considerably. These can range from a traditional static asset allocation to strategic, where permanent tilts are imbedded, but never changed, and of course, a tactical approach where the mix of assets change in anticipation of the future environment.
Regardless of the approach used, it leaves one to wonder what decisions are the appropriate ones to consider. Prior to Brinson, Hood and Beebower, investors prioritized stock selection over asset allocation. Without this knowledge investors could potentially be prioritizing the wrong thing again today. This article is not intended to identify which market cap or style is superior. There are varying opinions on this. For now, I will leave it at this…there are rarely silver bullets and absolutes, more realistically there is a time and a place for everything. Additionally, most of our readers know that we prefer a valuation-conscious approach to investing that is active in its asset selection. We will not include or debate methodologies here. There are many valid approaches, ours is just one of them. What this piece is intended to do is simply outline which decisions in developing an asset allocation are the most important to get correct and which are survivable if you get them wrong.
Approach & Findings
Let me begin by stating simply what we are attempting to determine. Is it more important to be consistently in the correct market cap or the correct style? Interestingly, at first glance this would appear to be a question of performance variability between market cap ranges or between opposing styles. By examining the tracking error or standard deviation of excess returns between the Russell 1000 large cap index and the Russell 2000 small cap index from January 1979 through August 2025 we find a rather substantial tracking error of 10%. Ironically, over this period and likely due to the recent dominance of large cap over small, large cap stocks gained 12.3% per year while small cap produced 11% per year for an average excess return of 1.3% per year. Applying our tracking error of 10% we know that 2/3 of our outcomes for excess returns should lie between +11.3% outperformance and -8.7% underperformance of large vs small. Hard to address the question with that range of outcomes.
Within the normal range, one can out or underperform by a large amount by favoring one or the other. What’s more, the degree of out and underperformance is fairly symmetrical ranging from +11 to minus 8.7%. This really hasn’t answered our question.
How about style? Again, to the surprise of Fama and French, growth stocks gained an annual 12.2% vs 11.7% for value. Ironically, while growth managed the win, value dominated for much of the period with growth rallying substantially based on exceptionally strong recent performance. The tracking error between the two…9.6%, not dissimilar from the 10% tracking error between market cap ranges. So, what have we learned? In full opposition to the work of Faama and French, large cap and growth were the winners over the period. But that wasn’t really the question. The question was which decision was more important to get correct. In other words, if you are active, should you devote more of your mental energy to determine what the correct market cap will be or which style should be preferred? That question remains unanswered by examining overall performance and tracking error.
Chart 2
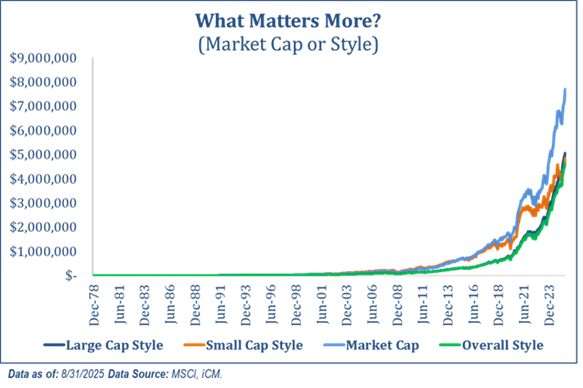
Our methodology for answering this first question is rather simple. Identify, on a monthly basis, the better of each return pair and compound that result. By doing so we hope to understand the outcome of getting each decision consistently correct or incorrect. The results are detailed in the chart below, showing the growth of $100 from 1979 until present. First, the obvious and not so surprising…being consistently right with either your cap or style decision yielded the best results. Now, perhaps the surprising part given the focus on style within today’s investment world, consistently allocating to the correct market cap was by far the stronger performer than allocating to the correct style, by a margin of nearly 2-1. But what’s interesting is how this strength is highlighted once we start to introduce a bit of error into the equation by asking a derivative question. If you were to only get one decision correct, and the other wrong, which would fare better, the correct cap and wrong style or the correct style and wrong cap? The answer is, as many would suspect, the correct cap and wrong style is the winner. The margin is what surprised me. By getting the cap correct and the style wrong, your $100 portfolio grew to $23,450. By reversing this and getting the cap wrong and the style correct, you’d still have done very well, but that $100 would have grown to $4,832, a more than 4-1 margin. The moral here, and to answer the original question, what matters more, cap or style? The answer is definitively; market cap matters more.
Conclusion
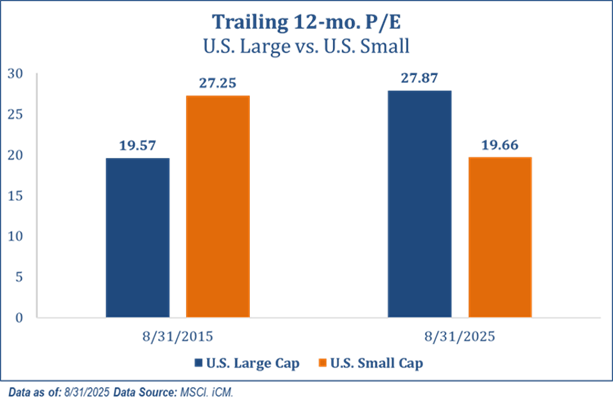
So, why does this matter today? As we began this article and perhaps not surprising given the known behavioral bias of home country, large well- known companies, and high-profile fast growers, investors are very lightly allocated to small market cap names. As history would indicate, most good things come to an end in the case of the large and small cap relationship, this is clearly one that has historically displayed an element of cyclicality. What perhaps makes this argument increasingly compelling is detailed in Chart 3.
A decade ago, Small Cap stocks traded at a PE multiple of 27x earnings vs 19x on large cap stocks. Large cap was the better value and ultimately the better performer. Since that date, earnings for small stocks have grown by 9.5% per year on average while large company earnings have grown by a similar but lower, 8%. As a result, the valuation picture has flipped, with small stocks trading at 19x and large stocks trading at 27×. While part of this discount is justifiable given the increased risk of owning a smaller company, it is not completely explained by that risk. In fact, since reaching their peak valuation in 2021, small cap earnings have advanced 39% while their price has only advanced 9%. In our view this makes small caps marginally cheap versus their large cap counterparts, certainly cheap enough to warrant a larger position in investors’ domestic equity portfolios. When you combine this with the idea that most are likely meaningfully under allocated to this segment of the market, or said differently meaningfully over exposed to an expensive large cap and growth segment of the market, I think it becomes fairly clear why investors would be wise to reconsider this decision before it’s too late. Thank you as always for your trust and confidence.
Chart 3
By Michael Paciotti, CFA
Originally published by Integrated Capital Management
For more news, information, and analysis, visit the ETF Strategist Content Hub.
All data as of 9/30/2025 unless otherwise noted.
Market Insights is intended solely to report on various investment views held by Integrated Capital Management, an institutional research and asset management firm, is distributed for informational and educational purposes only and is not intended to constitute legal, tax, accounting or investment advice. Opinions, estimates, forecasts, and statements of financial market trends that are based on current market conditions constitute our judgment and are subject to change without notice. Integrated Capital Management does not have any obligation to provide revised opinions in the event of changed circumstances. We believe the information provided here is reliable but should not be assumed to be accurate or complete. References to specific securities, asset classes and financial markets are for illustrative purposes only and do not constitute a solicitation, offer or recommendation to purchase or sell a security. Past performance is no guarantee of future results. All investment strategies and investments involve risk of loss and nothing within this report should be construed as a guarantee of any specific outcome or profit. Investors should make their own investment decisions based on their specific investment objectives and financial circumstances and are encouraged to seek professional advice before making any decisions. Index performance does not reflect the deduction of any fees and expenses, and if deducted, performance would be reduced. Indexes are unmanaged and investors are not able to invest directly into any index. (MMXXV-II)

