
The longest continuous yield curve inversion has finally come to an end. Or has it? The answer depends on how you measure it. That’s just one of my gripes with the yield curve inversion as an economic indicator, but before I get into that let’s back up a little bit.
Yield Curve Refresher
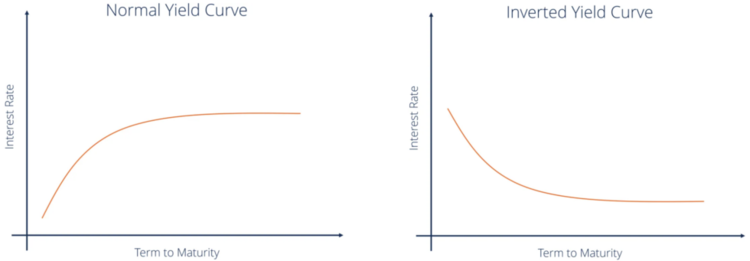
The yield curve shows the relationship between interest rates and the time to maturity for government bonds. An upward sloping yield curve is considered normal. Common sense tells us that investors should demand higher yields for bonds with more time to maturity. A downward sloping yield curve, or an “inverted” yield curve, is considered abnormal and often interpreted as a signal that economic trouble is on the horizon.
Using the Yield Curve as a Leading Indicator
It is commonly accepted in our industry that the two spreads1 most commonly used to assess the shape of the yield curve are the two-year treasury yield minus the ten-year yield and the three-month minus ten-year. Looking back at the last four recessions, by both measures the yield curve has inverted and un-inverted prior to each recession. Not a bad track record2, but if the yield curve un-inverts prior to each recession then it would seem that the un-inversion is a more important signal than the initial inversion.
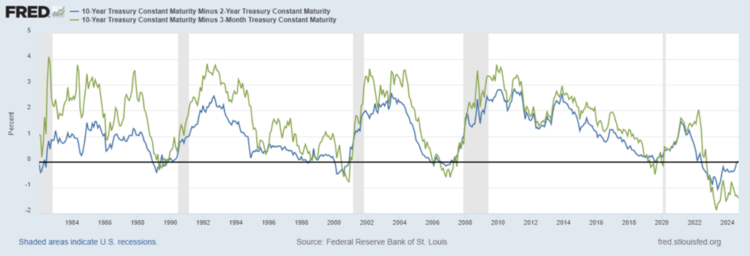
This brings us back to today. The two-year minus ten-year spread un-inverted last week after being inverted for *over two years*. Perhaps this is a useful time frame for academics, but from our perspective it confirms that the un-inversion is the event of note. Unfortunately, there’s a problem there too. The three-month minus ten-year spread is still at one of its most inverted levels in at least the past 40 years.
To summarize, over two years after warning that a recession was on the way, the two most commonly followed yield spreads are now telling us that the yield curve has either un-inverted or remains at one of its most inverted levels in over 40 years… From my perspective, this isn’t a very useful signal, but I don’t think this is what the yield curve is “telling” us.
So, what exactly is the yield curve telling us now?
In my opinion, the yield curve is telling us that the Federal Reserve’s (Fed’s) short-term interest rate policy is restrictive. I’m not here to argue correlation versus causation of restrictive Fed policy and recessions but the idea that restrictive monetary policy precedes recessions seems much more straightforward than bond investors sending up the bat signal. The market sets intermediate rates, such as the ten-year treasury, based on some expectation of future growth and inflation, and the Fed sets the short-term rate based on their policy goals. Everything in between is a function of the market’s expectations for the Fed’s actions.
To illustrate this point, the chart below shows the federal funds rate with periods when the yield curve was inverted3 highlighted. Every single time the yield curve has inverted (meaning the 2-year yield was greater than the 10-year yield) over the past fifty years it was during a Fed hiking cycle and subsequently un-inverted around when the Fed began cutting rates.
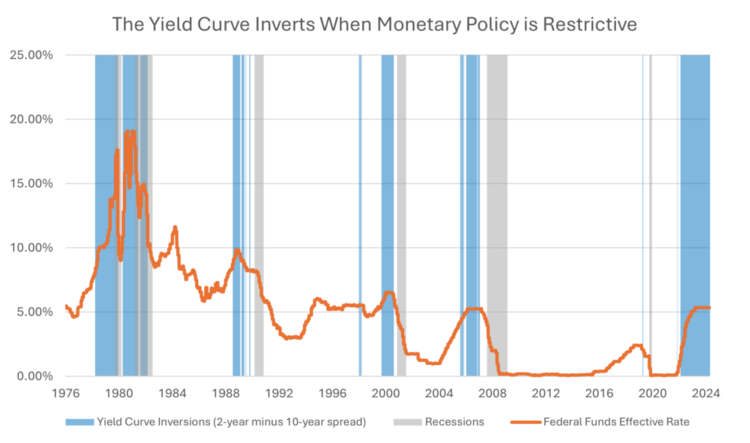
This may seem like an unnecessary distinction to some, but I do think it’s important to dissuade investors of the notion that the yield curve inversion is a signal being sent by omnipotent bond investors who know something that we don’t when the truth is much simpler than that. The yield curve inversion may appear to predict recessions, but it does so only in the sense that it reflects the Fed hiking rates near the end of the economic cycle and cutting rates going into a recession.
refers to the differences in yields between bonds. don’t think that bond investors knew that the pandemic was coming so that one was probably luck. curve inversions were determined using the two-year minus ten-year spread because it has a slightly longer history in the Federal Reserve Bank of St. Louis database and showing both spreads seems redundant.By Denis Rezendes, CFA, Partner, Portfolio Manager
Originally published September 12, 2024
For more news, information, and analysis, visit the ETF Strategist Channel.

