

Although the financial press has failed to discuss it at length, the United States bond market has just exited a long period in which the yield curve (the range of bond yields across maturities) was inverted (longer-term yields were lower than shorter-term yields). One popular summary measure of the yield curve is the difference between the 10-year Treasury note’s yield and the yield on the two-year Treasury note. By that measure, based on month-end figures, the yield curve was inverted for 25 straight months from July 2022 through August 2024. At its nadir of -0.93% in July 2023, the 10-year Treasury yield was 3.90% and the two-year Treasury yield was 4.83%. At the end of September 2024, this measure of the yield curve had turned positive at 0.10%, with the 10-year Treasury yield falling 18 basis points to 3.72% and the two-year Treasury yield falling 121 basis points to 3.62% (see table below). Positive, upward-sloping yield curves are considered more normal.
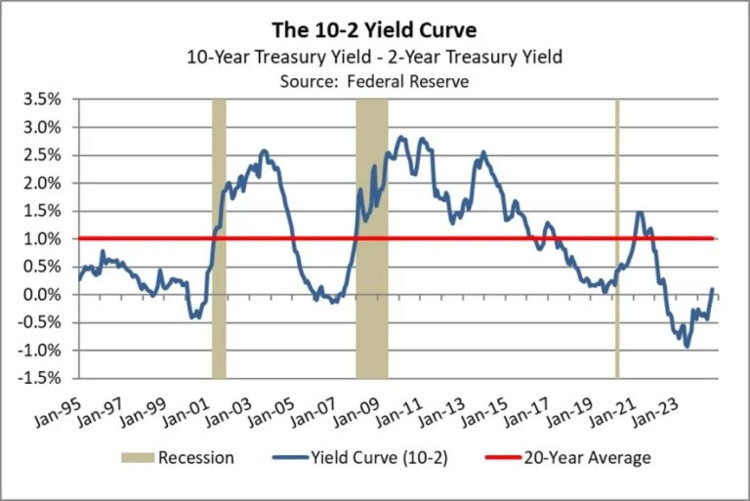
The yield curve is closely tracked because inversions have often signaled an impending recession and falling values for risk assets. At this point, it appears that the latest inversion was a false signal of recession. It does appear that US economic growth has slowed, but there are only limited signs currently that the economy could be heading into a broad decline. Investment strategists have nevertheless begun to focus on the implications of the yield curve turning positive again. Many are urging investors to rotate into longer-maturity bonds, apparently on the conviction that longer-maturity bonds will see big price gains (implying big yield declines), while shorter-maturity bonds will see smaller price gains (implying smaller yield declines). Is this reasonable?
To get at that question, we analyzed the total return (yield plus price change) for both five-year and 10-year Treasury notes after each of the eight un-inversions of the yield curve since the early 1960s. We focused on the total return for Treasury notes at three months, six months, and 12 months after the end of each inversion. The results of our analysis are shown in the table below.
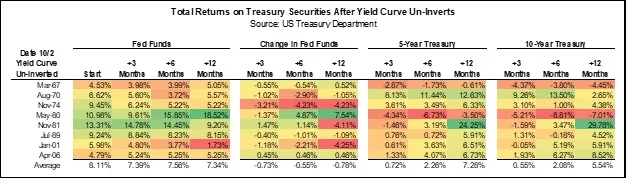
table shows that in the 12 months after the un-inversions since the 1960s, the average total returns on five-year and 10-year Treasury notes have been positive but not spectacular. The table suggests that the key variable is what happens with the Federal Reserve’s benchmark fed funds interest rate in the year after the un-inversion. To the extent that the fed funds rate declines in the year after un-inversion, total returns for longer-maturity Treasury obligations are greater. If the fed funds rate is basically stable in the year after un-inversion, investors’ total returns from longer-maturity Treasurys have been similar to the yield on those obligations. But if the fed funds rate increases in the year after un-inversion, the total returns on longer-maturity Treasurys have typically been negative.
Looking out at the coming year, investors widely expect the Fed to keep cutting the fed funds rate, so today’s ubiquitous calls for longer-maturity Treasurys may make some sense. However, investors should also not forget the burgeoning bond issuance that could potentially outpace demand. In our view, in addition to lower policy rates, the Fed may need to end its balance sheet reduction program to help alleviate some of the liquidity concerns in the bond market. Policymakers could also decide to cut rates gradually over the coming year and only moderate the pace of balance sheet reduction. That’s especially so after the strong September employment report, which pointed toward rebounding demand for labor and increased wage pressures. More broadly, modest policy easing would be expected if US economic growth remains healthy and/or consumer price inflation doesn’t cool as much as anticipated. Based on the analysis presented here, the resulting “restrictive for longer” approach to monetary policy would likely limit the total returns for longer-dated Treasurys. An economic soft landing and modest monetary easing mean the maturity extension trade probably doesn’t work.
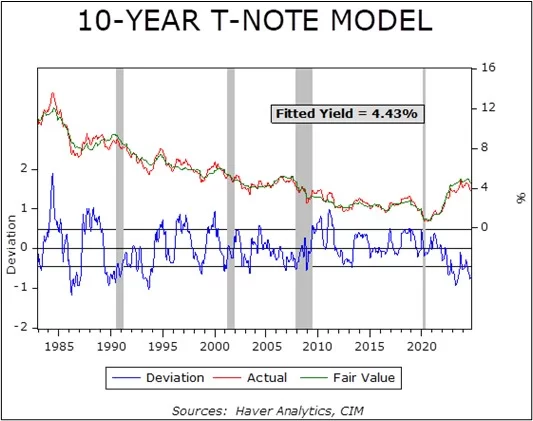
We also note that in the year after an un-inversion, the average total return on five-year Treasury notes is better than the total return on 10-year Treasurys, especially in cases where the fed funds rate increases. We see a similar implication from our bond model, which we use to predict fair value bond yields based on key economic indicators. When we plug a 3.25% fed funds rate into the model (roughly the level policymakers expect to reach by year-end 2025), we get a projected decline in the five-year Treasury yield from current levels but a rise to nearly 4.00% for the 10-year yield. (At today’s fed funds rate of 4.75% to 5.00%, the model estimates a fair value of 4.43% for the 10-year Treasury, as shown in the chart below.)
In sum, rotating into longer-maturity bonds to generate greater returns may not make sense right now, even if some observers are calling for it. Further normalization of the yield curve may indeed be in store as the Fed keeps cutting short-term interest rates, but those rate cuts may well prove modest if the US economy keeps growing. That could limit any price gains and total return opportunities in longer-dated fixed income. If the economy avoids a recession and reaccelerates, pushing up inflation again and potentially requiring renewed rate hikes, longer-maturity obligations could produce negative total returns. Keeping most bond exposure relatively short still seems to make sense today, even as it might be prudent to maintain some longer-maturity exposure to hedge against geopolitical risks.
By the Asset Allocation Committee
For more news, information, and analysis, visit the ETF Strategist Channel.
Disclosure Information
These reports were prepared by Confluence Investment Management LLC and reflect the current opinion of the authors. Opinions expressed are current as of the date shown and are based upon sources and data believed to be accurate and reliable. Opinions and forward-looking statements expressed are subject to change. This is not a solicitation or an offer to buy or sell any security. Past performance is no guarantee of future results. Information provided in this report is for educational and illustrative purposes only and should not be construed as individualized investment advice or a recommendation. Investments or strategies discussed may not be suitable for all investors. Investors must make their own decisions based on their specific investment objectives and financial circumstances.

