ETFdb Logo
  • ETF Database
  • Content Hubs
    • Themes
      • Active ETF
      • Alternatives
      • Artificial Intelligence
      • China Insights
      • Core Strategies
      • Crypto
      • Disruptive Technology
      • Energy Infrastructure
      • ETF Building Blocks
      • ETF Investing
      • ETF Strategist
      • Financial Literacy
      • Fixed Income
      • Free Cash Flow
      • Future ETFs
      • Innovative ETFs
      • Institutional Income Strategies
      • Leveraged & Inverse
      • Market Insights
      • Market Outlooks
      • Modern Alpha
      • Nuclear Energy
      • Portfolio Strategies
      • Sector Investing
      • Tax Efficient Income
      • Thematic Investing
    • Asset Class
      • Equity
        • U.S. Equity
        • Int'l Developed
        • Emerging Market Equities
      • Alternatives
        • Gold/Silver/Critical Materials
        • Cryptocurrency
        • Currency
        • Volatility
      • Fixed Income
        • Investment Grade Corporates
        • US Treasuries & TIPS
        • High Yield Corporates
        • Int'l Fixed Income
    • ETF Ecosystem
    • ETFs in Canada
    • Market Outlook
    • Crypto ETF Hub
  • Tools
    • ETF Screener
    • ETF Country Exposure Tool
    • ETF Database Categories
    • Indexes
    • Scenario Analysis
    • Watchlists
    • Head-To-Head ETF Comparison Tool
    • Mutual Fund To ETF Converter
    • ETF Stock Exposure Tool
    • ETF Issuer Fund Flows
  • Research
    • ETF Education
    • Equity Investing
    • Dividend ETFs
    • Leveraged ETFs
    • Inverse ETFs
    • Index Education
    • Index Insights
    • Top ETF Sectors
    • Top ETF Issuers
    • Top ETF Industries
  • Webcasts
  • Sectors
    • Sector Investing Content Hub
    • XLK
    • XLI
    • XLU
    • XLY
    • XLP
    • XLRE
    • Sector Power Rankings
    • XLE
    • XLC
    • XLF
    • XLV
    • XLB
  • Multimedia
    • ETF 360 Video Series
    • ETF of the Week Podcast
    • Gaining Perspective Podcast
    • ETF Prime Podcast
    • Video
  • Company
    • About VettaFi
    • Get VettaFi’ed
  • PRO
    • Pro Content
    • Pro Tools
    • Advanced
    • FAQ
    • Free sign up
    • Login
  1. Financial Literacy Content Hub
  2. The Total Return Roller Coaster
Financial Literacy Content Hub
Share

The Total Return Roller Coaster

Jennifer NashApr 12, 2024
2024-04-12

Here’s an interesting set of charts that will especially resonate with those of us who follow economic and market cycles. Imagine that five years ago you invested $10,000 in the S&P 500. How much would it be worth today, with dividends reinvested but adjusted for inflation?

The purchasing power of your investment has increased to $16,666 for an annualized real return of 10.26%.

The purchasing power

Content continues below advertisement

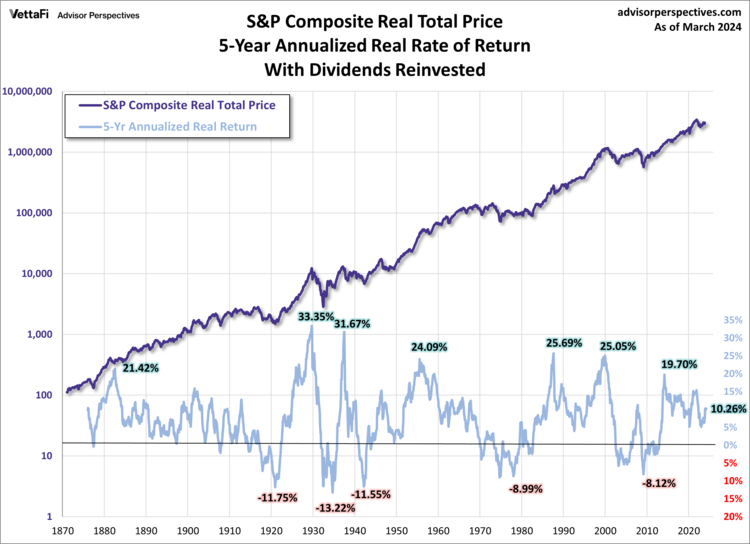
Had we posed the same question in March 2009, the answer would have been a depressing $6,654. The -8.12% real return would have cut the purchasing power of your initial investment by a third.

Total Returns Roller Coaster

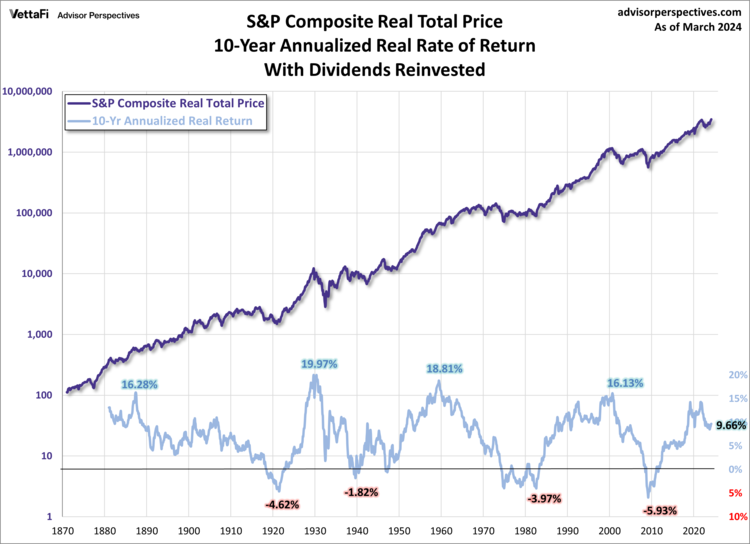
Let’s increase the time frame to 10 years. The annualized return becomes slightly smaller than the 5-year time frame. As of the end of last month, your $10,000 invested 10 years ago has grown to $26,175 adjusted for inflation, an annualized real return of 9.66%.

Total Returns Roller Coaster

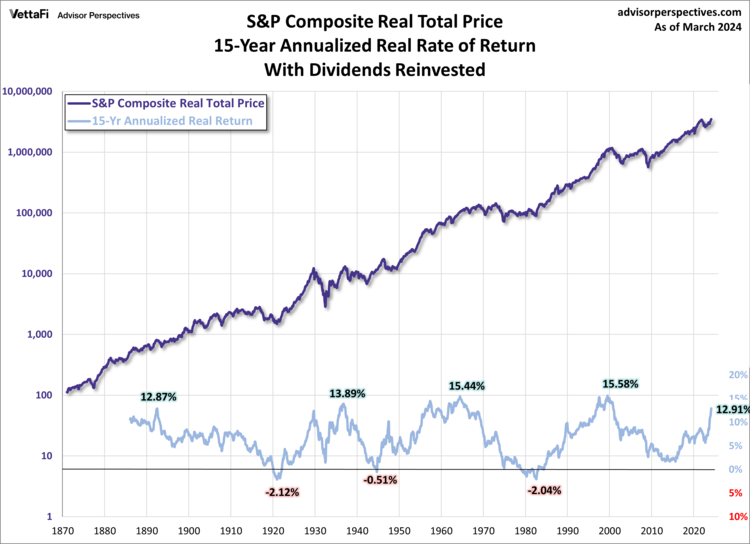
The 15-year time frame has a larger annualized return than both the 5- and 10-year periods. Your one-and-a-half decade investment of $10,000 has grown to $68,639 adjusted for inflation for an annualized real return of 12.91%.

The 15-year time frame

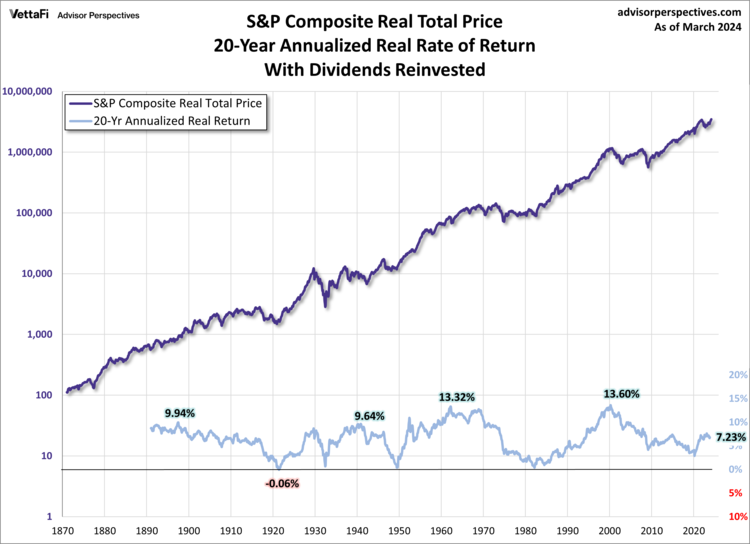
If we extend our investment horizon to 20 years, the roller coaster is less volatile with higher lows and lower highs. Your two decade investment of $10,000 has grown to $42,305 adjusted for inflation for an annualized real return of 7.23%.

If we extend our

An investment of $10,000 made 30 years ago has now grown to $99,004 adjusted for inflation for an annualized real return of 7.67%. The volatility decreases further with a 30-year timeline. But even for that three-decade investment, the annualized returns since 1901 have ranged from less than 2% to over 11%.

As these charts illustrate

As these charts illustrate, and as many households have discovered during the 21st century so far, investing in equities carries substantial risk. Households approaching retirement should understand this risk and make rational decisions about diversification.

ETFs associated with the S&P 500 include: iShares Core S&P 500 ETF (IVV A), SPDR S&P 500 ETF Trust (SPY A-), Vanguard S&P 500 ETF (VOO A), and  SPDR Portfolio S&P 500 ETF (SPLG A-).

Originally published on Advisor Perspectives. 

For more news, information, and analysis, visit the Financial Literacy Channel.

Loading Articles...

Advertisement

Is Your Portfolio Positioned With Enough Global Exposure?

ETF Education Channel

How to Allocate Commodities in Portfolios

Tom LydonApr 26, 2022
2022-04-26

A long-running debate in asset allocation circles is how much of a portfolio an investor should...

Core Strategies Channel

Why ETFs Experience Limit Up/Down Protections

Karrie GordonMay 13, 2022
2022-05-13

In a digital age where information moves in milliseconds and millions of participants can transact...

}
X