

Our monthly market valuation updates have long had the same conclusion: US stock indexes are significantly overvalued, which suggests cautious expectations for investment returns. This analysis focuses on the P/E10 ratio, a key indicator of market valuation, and its correlation with inflation and the 10-year Treasury yield.
Market Valuation (P/E10) and Inflation
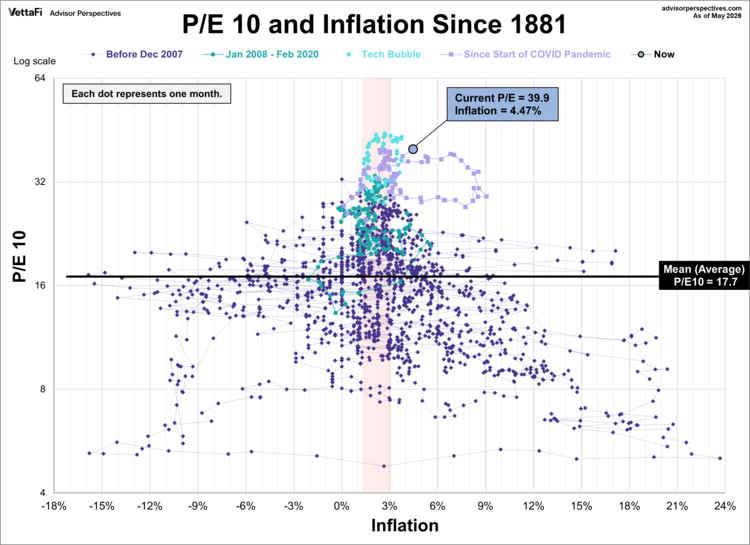
The relationship between market valuation, as represented by the P/E10 ratio, and inflation reveals crucial patterns. The following scatter graph illustrates this relationship across three distinct periods. Those are January 1881 to December 2007, January 2008 to February 2020, and March 2020 to the present.
Key observations from the graph include:
- Historical Periods: The graph clearly delineates the three timeframes, allowing for comparative analysis.
- Tech Bubble: The extreme overvaluation during the tech bubble (June 1997 to January 2002), defined arbitrarily as a P/E10 of 25 or higher, is highlighted.
- Average P/E10: The graph displays the historical average P/E10 of 17.7, providing a benchmark for current valuations.
- Current Position: The current P/E10 and inflation rate are clearly marked.
- Inflation “Sweet Spot”: The shaded red area indicates the inflation “sweet spot” (approximately 1.4% to 3.0%), a range historically associated with higher valuations.
The inflation figure presented is the year-over-year change. Note: Due to the lapse in official Consumer Price Index (CPI) reports from the government shutdown in 2025, the inflation figure for October 2025 been extrapolated using the two prior months’ data.
Understanding the Inflation "Sweet Spot"
The “sweet spot” of 1.4% to 3.0% inflation has historically supported higher market valuations. Currently, the P/E10 stands at 39.9, with a year-over-year inflation rate of 4.47%. This places us outside the “sweet spot” and within the “extreme valuation territory” previously observed during the tech bubble. This means that the current valuation is very high compared to historical norms, and traditionally, these periods are associated with higher risk of market downturns.
Market Valuation (P/E10) and the 10-Year Treasury Yield
A common question is whether a valuation metric such as the P/E10 has any merit in a world with Treasury yields at low levels. To address this, we examine the correlation between P/E10 and the 10-year Treasury yield.
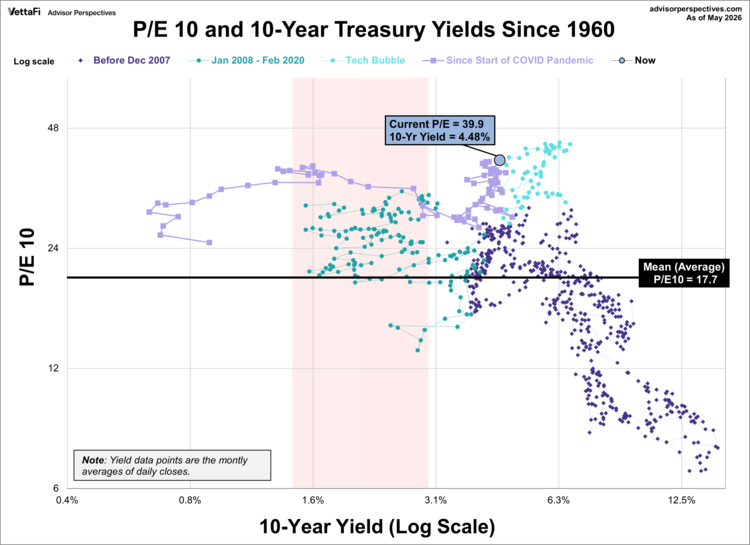
This chart begins in 1960, as recommended by Ed Easterling of Crestmont Research, because prior to this period, bond yields did not consistently respond to inflation changes.
Key observations include:
- Post-Financial Crisis: The dark green dots represent the period following the 2008 financial crisis, characterized by unprecedented low yields and high P/E10 ratios.
- Inflation “Sweet Spot”: The inflation “sweet spot” is highlighted to show its correlation with yield and valuation.
- Current Yield: The latest monthly average of the 10-year yield is 4.48%.
- Extreme Valuation Territory: Again, the P/E10 valuation is in extreme valuation territory
The post-financial crisis period presented “uncharted” territory, with P/E10 ratios above 20 and yields below 2.5%. This deviated significantly from historical patterns. The current yield of 4.48% suggests a shift away from this unprecedented period and towards a time similar to that of the tech bubble.
ETFs associated with Treasuries include: Vanguard 0-3 Month Treasury Bill ETF (VBIL ), Vanguard Intermediate-Term Treasury ETF (VGIT ), and Vanguard Long-Term Treasury ETF (VGLT ).
Originally published on Advisor Perspectives
For more news, information, and analysis, visit the Fixed Income Content Hub.

