

With 2024 behind us, let’s revisit the top 10 most-read charts of the year. These charts covered market updates, valuations, and economic indicators. They offered valuable insights into the economic and financial landscape that defined the past year.
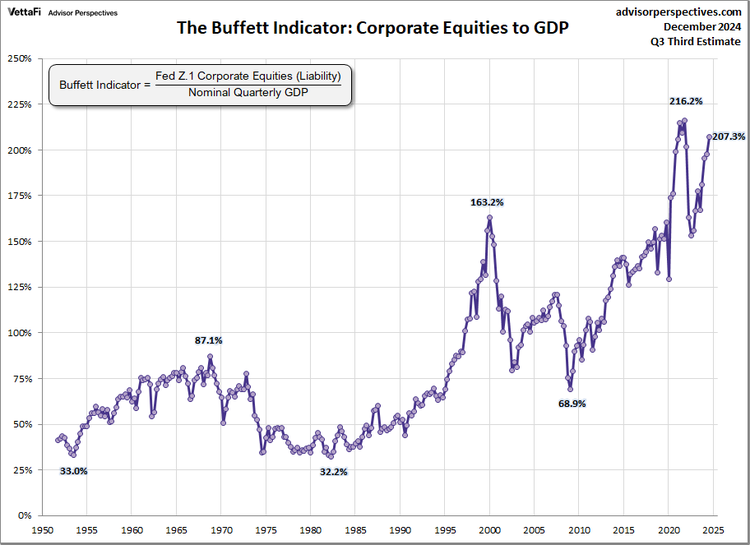
1. Buffett Valuation Indicator: A long-term valuation metric comparing the total market value of publicly traded stocks to the country’s GDP. Using the Q3 GDP third estimate and December S&P 500 close data, the latest reading is 207.3%, signaling an overvalued market. Watch Video
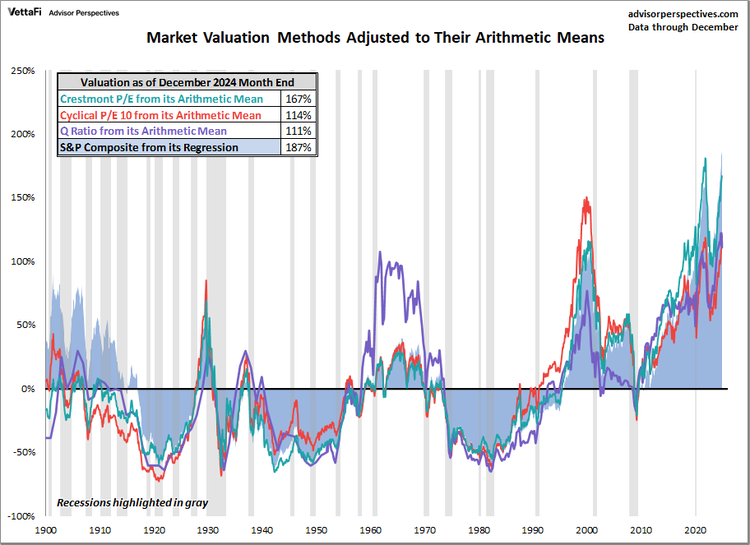
2. Market Valuation Overview: A comparative analysis of four valuation indicators (Regression to Trend, Crestmont P/E, Q-Ratio, and P/E 10). Based on December’s S&P 500 monthly data, the market is OVERVALUED somewhere in the range of 111% to 187%, depending on the indicator. Watch Video
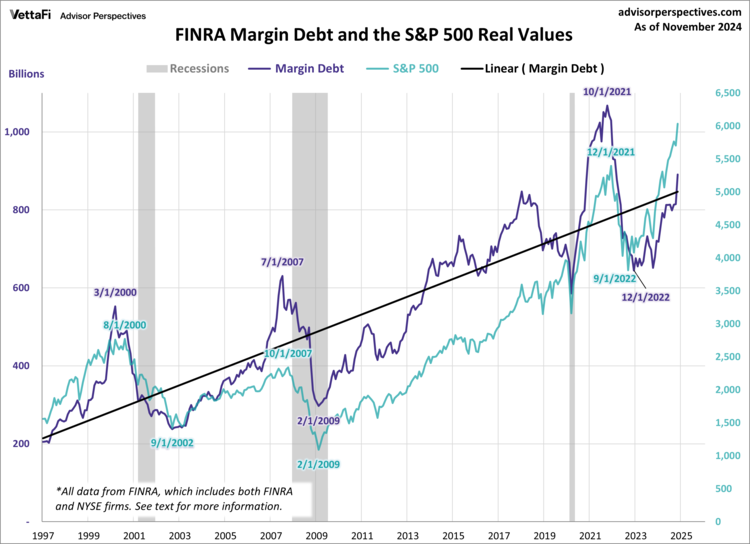
3. Margin Debt: A depiction of the money investors borrowed from brokers via margin accounts. The latest debt level is at $890.852 billion, the highest level since December 2021. Watch Video
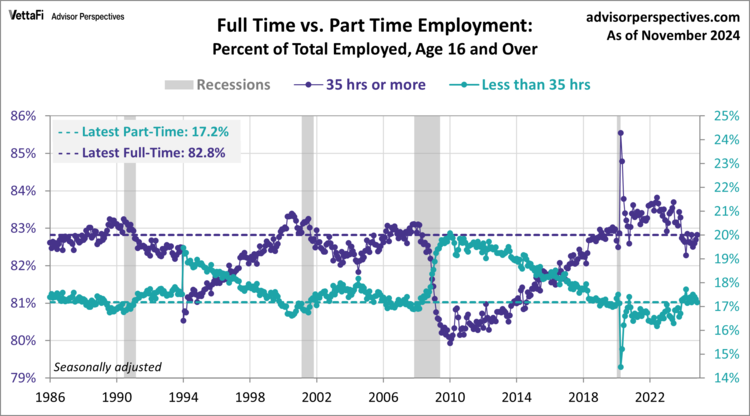
4. A Closer Look at Full-Time & Part-Time Employment: A closer look at the monthly employment numbers with a focus on full- and part-time employment. The latest jobs report from November showed the number of full-time workers decreased by 111,000. The number of part-time workers decreased by 268,000. Watch Video
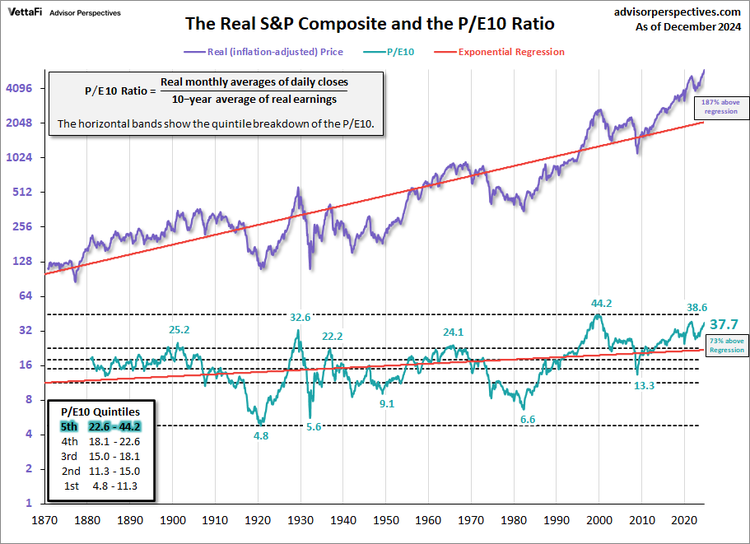
5. P/E 10 Market Valuation Update: A long-term valuation indicator calculated by dividing the current S&P 500 price by the average inflation-adjusted earnings over the past 10 years. At the end of December, the P/E 10 Ratio was at 37.7, signaling an overvalued market.
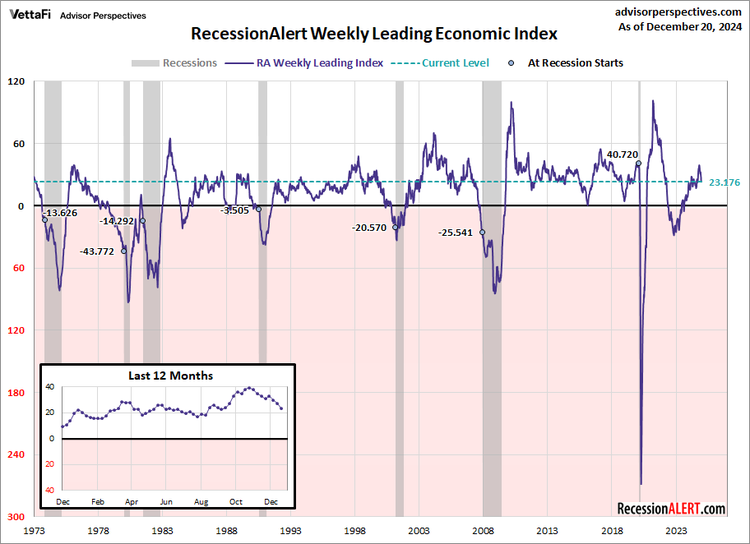
6. RecessionAlert Weekly Leading Economic Index: A composite index anticipating the likelihood of recession based on six broad categories. The WLEI was positive for all of 2024. But the latest reading marks the lowest level for the index since early September. Watch Video
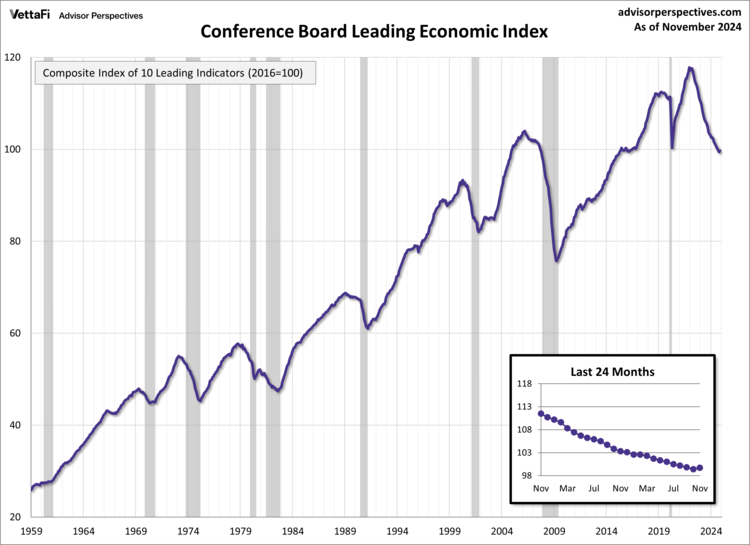
7. Conference Board Leading Economic Indicator (LEI): A composite index predicting business cycle turning points and anticipating economic trends. The latest data point from November showed the LEI increased for the first time since February 2022. It rose slightly to 99.7. Watch Video
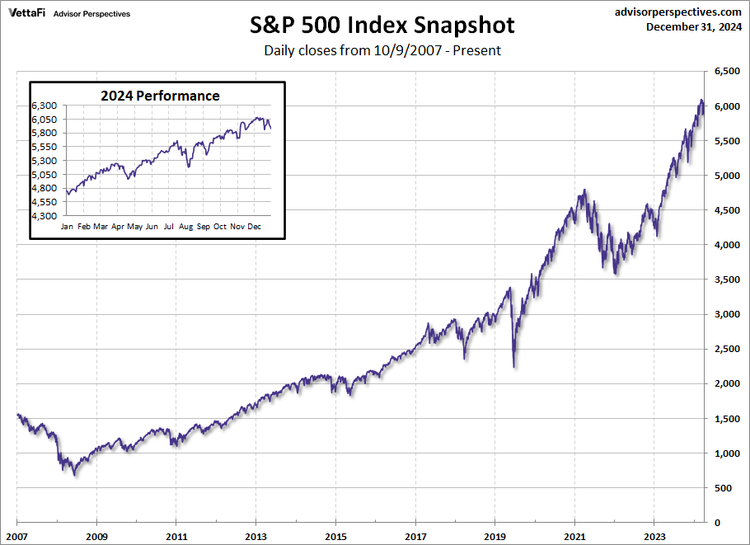
8. S&P 500 Snapshot: A weekly update that highlights the S&P 500’s performance and broader index trends. The index finished 2024 up 24.01% and set 57 new all-time highs during the year.
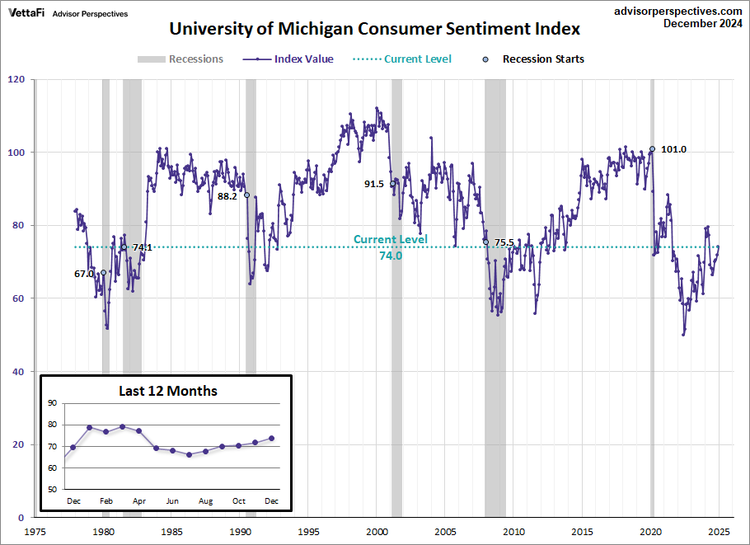
9. Michigan Consumer Sentiment: A monthly survey of consumer confidence levels with regards to the economy, personal finances, business conditions, and buying conditions. The index closed out the year by rising for a fifth consecutive month to 74.0. That’s its highest level since April 2024.
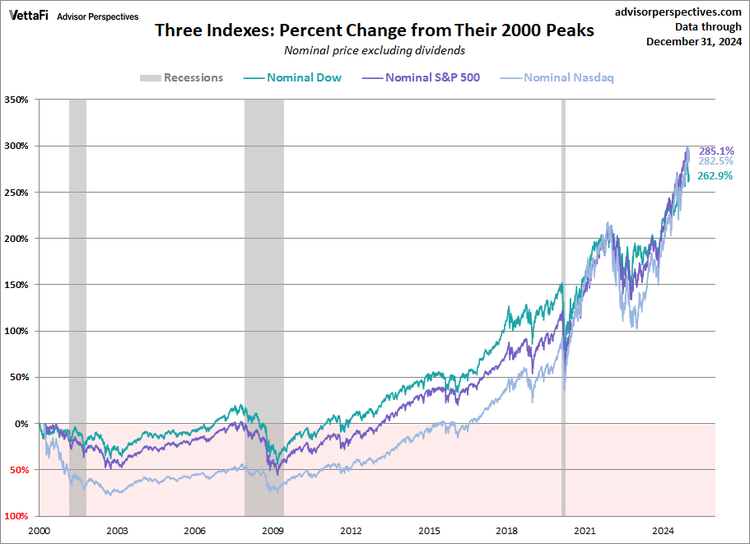
10. The S&P, Dow, and Nasdaq Since 2000: An examination of three major U.S. indices and how they have changed since their 2000s peaks. At the end of 2024, the Dow has grown 263%, the S&P 500 has grown 285%, and the Nasdaq has grown 282% since their respective highs from 2000. However, when adjusted for inflation, the real growth is reduced to 97% for the Dow, 109% for the S&P 500, and 108% for the Nasdaq. Watch Video
Visit the rest of the AP Charts library here.
ETFs associated with the S&P 500 include: iShares Core S&P 500 ETF (IVV ), SPDR S&P 500 ETF Trust (SPY ), Vanguard S&P 500 ETF (VOO ), and SPDR Portfolio S&P 500 ETF (SPLG ).
Originally published on Advisor Perspectives
For more news, information, and analysis, visit the Fixed Income Channel.

